Evaluation of Greenhouse Gas Emissions from Septic ... - Geoflow
Evaluation of Greenhouse Gas Emissions from Septic ... - Geoflow
Evaluation of Greenhouse Gas Emissions from Septic ... - Geoflow

Create successful ePaper yourself
Turn your PDF publications into a flip-book with our unique Google optimized e-Paper software.
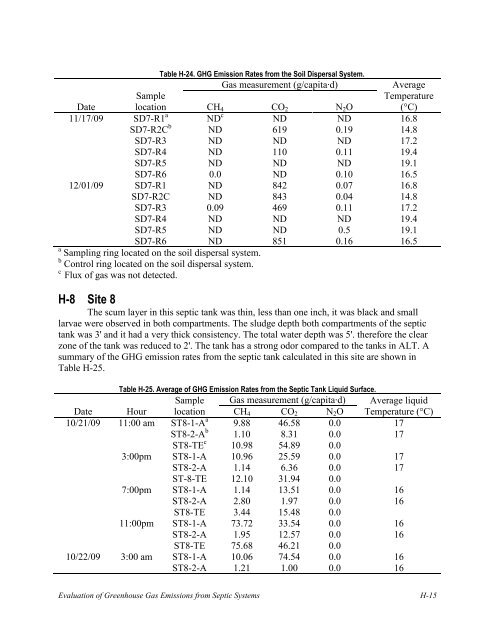
Table H-24. GHG Emission Rates <strong>from</strong> the Soil Dispersal System.<strong>Gas</strong> measurement (g/capita·d)AverageDateSamplelocation CH 4 CO 2 N 2 OTemperature(°C)11/17/09 SD7-R1 a ND c ND ND 16.8SD7-R2C b ND 619 0.19 14.8SD7-R3 ND ND ND 17.2SD7-R4 ND 110 0.11 19.4SD7-R5 ND ND ND 19.1SD7-R6 0.0 ND 0.10 16.512/01/09 SD7-R1 ND 842 0.07 16.8SD7-R2C ND 843 0.04 14.8SD7-R3 0.09 469 0.11 17.2SD7-R4 ND ND ND 19.4SD7-R5 ND ND 0.5 19.1SD7-R6 ND 851 0.16 16.5a Sampling ring located on the soil dispersal system.b Control ring located on the soil dispersal system.cFlux <strong>of</strong> gas was not detected.H-8 Site 8The scum layer in this septic tank was thin, less than one inch, it was black and smalllarvae were observed in both compartments. The sludge depth both compartments <strong>of</strong> the septictank was 3' and it had a very thick consistency. The total water depth was 5'. therefore the clearzone <strong>of</strong> the tank was reduced to 2'. The tank has a strong odor compared to the tanks in ALT. Asummary <strong>of</strong> the GHG emission rates <strong>from</strong> the septic tank calculated in this site are shown inTable H-25.Table H-25. Average <strong>of</strong> GHG Emission Rates <strong>from</strong> the <strong>Septic</strong> Tank Liquid Surface.Sample <strong>Gas</strong> measurement (g/capita·d) Average liquidDate Hour location CH 4 CO 2 N 2 O Temperature (°C)10/21/09 11:00 am ST8-1-A a 9.88 46.58 0.0 17ST8-2-A b 1.10 8.31 0.0 17ST8-TE c 10.98 54.89 0.03:00pm ST8-1-A 10.96 25.59 0.0 17ST8-2-A 1.14 6.36 0.0 17ST-8-TE 12.10 31.94 0.07:00pm ST8-1-A 1.14 13.51 0.0 16ST8-2-A 2.80 1.97 0.0 16ST8-TE 3.44 15.48 0.011:00pm ST8-1-A 73.72 33.54 0.0 16ST8-2-A 1.95 12.57 0.0 16ST8-TE 75.68 46.21 0.010/22/09 3:00 am ST8-1-A 10.06 74.54 0.0 16ST8-2-A 1.21 1.00 0.0 16<strong>Evaluation</strong> <strong>of</strong> <strong>Greenhouse</strong> <strong>Gas</strong> <strong>Emissions</strong> <strong>from</strong> <strong>Septic</strong> Systems H-15