Evaluation of Greenhouse Gas Emissions from Septic ... - Geoflow
Evaluation of Greenhouse Gas Emissions from Septic ... - Geoflow
Evaluation of Greenhouse Gas Emissions from Septic ... - Geoflow

You also want an ePaper? Increase the reach of your titles
YUMPU automatically turns print PDFs into web optimized ePapers that Google loves.
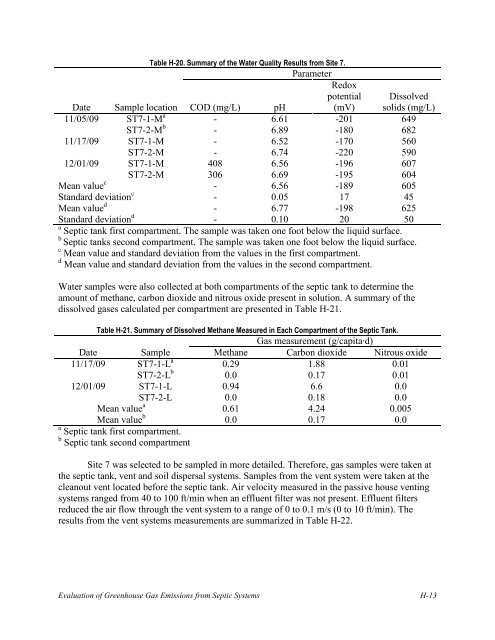
Table H-20. Summary <strong>of</strong> the Water Quality Results <strong>from</strong> Site 7.ParameterRedoxDate Sample location COD (mg/L) pHpotential(mV)Dissolvedsolids (mg/L)11/05/09 ST7-1-M a - 6.61 -201 649ST7-2-M b - 6.89 -180 68211/17/09 ST7-1-M - 6.52 -170 560ST7-2-M - 6.74 -220 59012/01/09 ST7-1-M 408 6.56 -196 607ST7-2-M 306 6.69 -195 604Mean value c - 6.56 -189 605Standard deviation c - 0.05 17 45Mean value d - 6.77 -198 625Standard deviation d - 0.10 20 50a <strong>Septic</strong> tank first compartment. The sample was taken one foot below the liquid surface.b<strong>Septic</strong> tanks second compartment. The sample was taken one foot below the liquid surface.c Mean value and standard deviation <strong>from</strong> the values in the first compartment.d Mean value and standard deviation <strong>from</strong> the values in the second compartment.Water samples were also collected at both compartments <strong>of</strong> the septic tank to determine theamount <strong>of</strong> methane, carbon dioxide and nitrous oxide present in solution. A summary <strong>of</strong> thedissolved gases calculated per compartment are presented in Table H-21.Table H-21. Summary <strong>of</strong> Dissolved Methane Measured in Each Compartment <strong>of</strong> the <strong>Septic</strong> Tank.<strong>Gas</strong> measurement (g/capita·d)Date Sample Methane Carbon dioxide Nitrous oxide11/17/09 ST7-1-L a 0.29 1.88 0.01ST7-2-L b 0.0 0.17 0.0112/01/09 ST7-1-L 0.94 6.6 0.0ST7-2-L 0.0 0.18 0.0Mean value a 0.61 4.24 0.005Mean value b 0.0 0.17 0.0a <strong>Septic</strong> tank first compartment.<strong>Septic</strong> tank second compartmentSite 7 was selected to be sampled in more detailed. Therefore, gas samples were taken atthe septic tank, vent and soil dispersal systems. Samples <strong>from</strong> the vent system were taken at thecleanout vent located before the septic tank. Air velocity measured in the passive house ventingsystems ranged <strong>from</strong> 40 to 100 ft/min when an effluent filter was not present. Effluent filtersreduced the air flow through the vent system to a range <strong>of</strong> 0 to 0.1 m/s (0 to 10 ft/min). Theresults <strong>from</strong> the vent systems measurements are summarized in Table H-22.<strong>Evaluation</strong> <strong>of</strong> <strong>Greenhouse</strong> <strong>Gas</strong> <strong>Emissions</strong> <strong>from</strong> <strong>Septic</strong> Systems H-13