Evaluation of Greenhouse Gas Emissions from Septic ... - Geoflow
Evaluation of Greenhouse Gas Emissions from Septic ... - Geoflow
Evaluation of Greenhouse Gas Emissions from Septic ... - Geoflow

You also want an ePaper? Increase the reach of your titles
YUMPU automatically turns print PDFs into web optimized ePapers that Google loves.
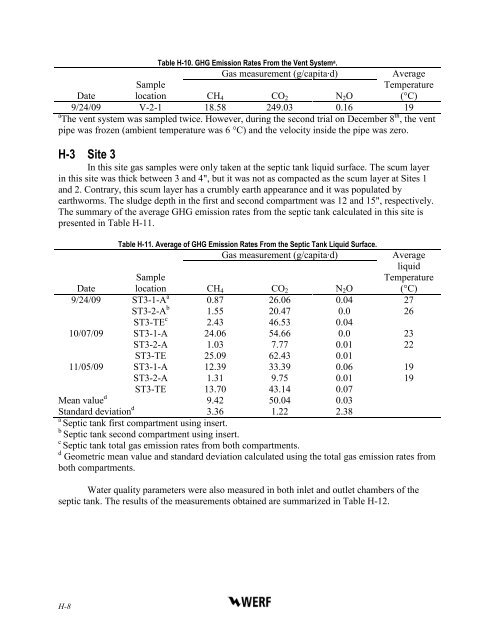
Table H-10. GHG Emission Rates From the Vent System a .<strong>Gas</strong> measurement (g/capita·d)AverageDateSamplelocation CH 4 CO 2 N 2 OTemperature(°C)9/24/09 V-2-1 18.58 249.03 0.16 19a The vent system was sampled twice. However, during the second trial on December 8 th , the ventpipe was frozen (ambient temperature was 6 °C) and the velocity inside the pipe was zero.H-3 Site 3In this site gas samples were only taken at the septic tank liquid surface. The scum layerin this site was thick between 3 and 4", but it was not as compacted as the scum layer at Sites 1and 2. Contrary, this scum layer has a crumbly earth appearance and it was populated byearthworms. The sludge depth in the first and second compartment was 12 and 15", respectively.The summary <strong>of</strong> the average GHG emission rates <strong>from</strong> the septic tank calculated in this site ispresented in Table H-11.Table H-11. Average <strong>of</strong> GHG Emission Rates From the <strong>Septic</strong> Tank Liquid Surface.<strong>Gas</strong> measurement (g/capita·d)AverageliquidDateSamplelocation CH 4 CO 2 N 2 OTemperature(°C)9/24/09 ST3-1-A a 0.87 26.06 0.04 27ST3-2-A b 1.55 20.47 0.0 26ST3-TE c 2.43 46.53 0.0410/07/09 ST3-1-A 24.06 54.66 0.0 23ST3-2-A 1.03 7.77 0.01 22ST3-TE 25.09 62.43 0.0111/05/09 ST3-1-A 12.39 33.39 0.06 19ST3-2-A 1.31 9.75 0.01 19ST3-TE 13.70 43.14 0.07Mean value d 9.42 50.04 0.03Standard deviation d 3.36 1.22 2.38a<strong>Septic</strong> tank first compartment using insert.b<strong>Septic</strong> tank second compartment using insert.c<strong>Septic</strong> tank total gas emission rates <strong>from</strong> both compartments.d Geometric mean value and standard deviation calculated using the total gas emission rates <strong>from</strong>both compartments.Water quality parameters were also measured in both inlet and outlet chambers <strong>of</strong> theseptic tank. The results <strong>of</strong> the measurements obtained are summarized in Table H-12.H-8