Introductory Exercises for GIS Using ArcMap & ArcCatalog
Introductory Exercises for GIS Using ArcMap & ArcCatalog
Introductory Exercises for GIS Using ArcMap & ArcCatalog
Create successful ePaper yourself
Turn your PDF publications into a flip-book with our unique Google optimized e-Paper software.
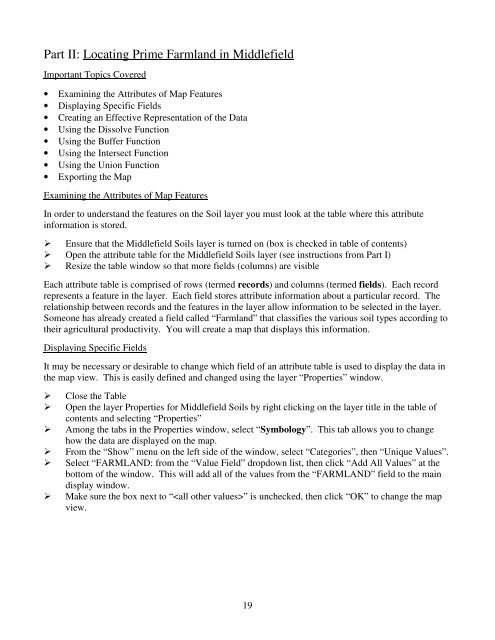
Part II: Locating Prime Farmland in MiddlefieldImportant Topics Covered• Examining the Attributes of Map Features• Displaying Specific Fields• Creating an Effective Representation of the Data• <strong>Using</strong> the Dissolve Function• <strong>Using</strong> the Buffer Function• <strong>Using</strong> the Intersect Function• <strong>Using</strong> the Union Function• Exporting the MapExamining the Attributes of Map FeaturesIn order to understand the features on the Soil layer you must look at the table where this attributein<strong>for</strong>mation is stored. Ensure that the Middlefield Soils layer is turned on (box is checked in table of contents) Open the attribute table <strong>for</strong> the Middlefield Soils layer (see instructions from Part I) Resize the table window so that more fields (columns) are visibleEach attribute table is comprised of rows (termed records) and columns (termed fields). Each recordrepresents a feature in the layer. Each field stores attribute in<strong>for</strong>mation about a particular record. Therelationship between records and the features in the layer allow in<strong>for</strong>mation to be selected in the layer.Someone has already created a field called “Farmland” that classifies the various soil types according totheir agricultural productivity. You will create a map that displays this in<strong>for</strong>mation.Displaying Specific FieldsIt may be necessary or desirable to change which field of an attribute table is used to display the data inthe map view. This is easily defined and changed using the layer “Properties” window.Close the TableOpen the layer Properties <strong>for</strong> Middlefield Soils by right clicking on the layer title in the table ofcontents and selecting “Properties”Among the tabs in the Properties window, select “Symbology”. This tab allows you to changehow the data are displayed on the map.From the “Show” menu on the left side of the window, select “Categories”, then “Unique Values”.Select “FARMLAND: from the “Value Field” dropdown list, then click “Add All Values” at thebottom of the window. This will add all of the values from the “FARMLAND” field to the maindisplay window.Make sure the box next to “” is unchecked, then click “OK” to change the mapview.19


