World Agricultural Supply and Demand Estimates
World Agricultural Supply and Demand Estimates
World Agricultural Supply and Demand Estimates

You also want an ePaper? Increase the reach of your titles
YUMPU automatically turns print PDFs into web optimized ePapers that Google loves.
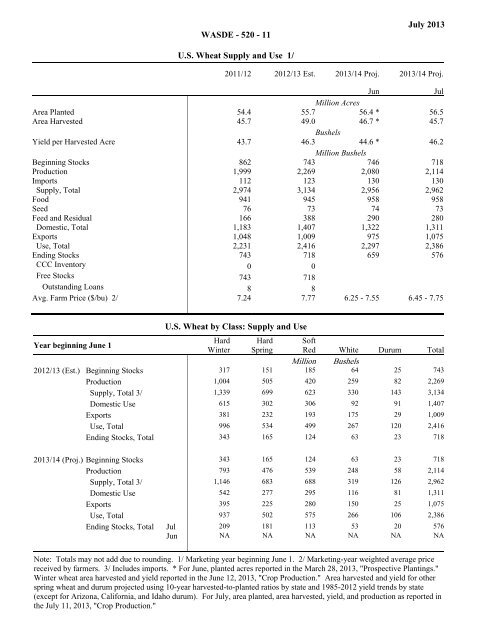
WASDE - 520 - 11July 2013U.S. Wheat <strong>Supply</strong> <strong>and</strong> Use 1/2011/12 2012/13 Est. 2013/14 Proj. 2013/14 Proj.JunJulMillion AcresArea Planted 54.4 55.7 56.4 * 56.5Area Harvested 45.7 49.0 46.7 * 45.7BushelsYield per Harvested Acre 43.7 46.3 44.6 * 46.2Million BushelsBeginning Stocks 862 743 746 718Production 1,999 2,269 2,080 2,114Imports 112 123 130 130<strong>Supply</strong>, Total 2,974 3,134 2,956 2,962Food 941 945 958 958Seed 76 73 74 73Feed <strong>and</strong> Residual 166 388 290 280Domestic, Total 1,183 1,407 1,322 1,311Exports 1,048 1,009 975 1,075Use, Total 2,231 2,416 2,297 2,386Ending Stocks 743 718 659 576CCC Inventory 0 0Free Stocks 743 718Outst<strong>and</strong>ing Loans 8 8Avg. Farm Price ($/bu) 2/ 7.24 7.77 6.25 - 7.55 6.45 - 7.75Year beginning June 1U.S. Wheat by Class: <strong>Supply</strong> <strong>and</strong> UseHardWinterHardSpringSoftRed White Durum Total2012/13 (Est.) Beginning StocksMillionBushels317 151 185 64 25 743Production 1,004 505 420 259 82 2,269<strong>Supply</strong>, Total 3/ 1,339 699 623 330 143 3,134Domestic Use 615 302 306 92 91 1,407Exports 381 232 193 175 29 1,009Use, Total 996 534 499 267 120 2,416Ending Stocks, Total 343 165 124 63 23 7182013/14 (Proj.) Beginning Stocks 343 165 124 63 23 718Production 793 476 539 248 58 2,114<strong>Supply</strong>, Total 3/ 1,146 683 688 319 126 2,962Domestic Use 542 277 295 116 81 1,311Exports 395 225 280 150 25 1,075Use, Total 937 502 575 266 106 2,386Ending Stocks, Total Jul 209 181 113 53 20 576Ending Stocks, Total Jun NA NA NA NA NA NANote: Totals may not add due to rounding. 1/ Marketing year beginning June 1. 2/ Marketing-year weighted average pricereceived by farmers. 3/ Includes imports. * For June, planted acres reported in the March 28, 2013, "Prospective Plantings."Winter wheat area harvested <strong>and</strong> yield reported in the June 12, 2013, "Crop Production." Area harvested <strong>and</strong> yield for otherspring wheat <strong>and</strong> durum projected using 10-year harvested-to-planted ratios by state <strong>and</strong> 1985-2012 yield trends by state(except for Arizona, California, <strong>and</strong> Idaho durum). For July, area planted, area harvested, yield, <strong>and</strong> production as reported inthe July 11, 2013, "Crop Production."