World Agricultural Supply and Demand Estimates
World Agricultural Supply and Demand Estimates
World Agricultural Supply and Demand Estimates

Create successful ePaper yourself
Turn your PDF publications into a flip-book with our unique Google optimized e-Paper software.
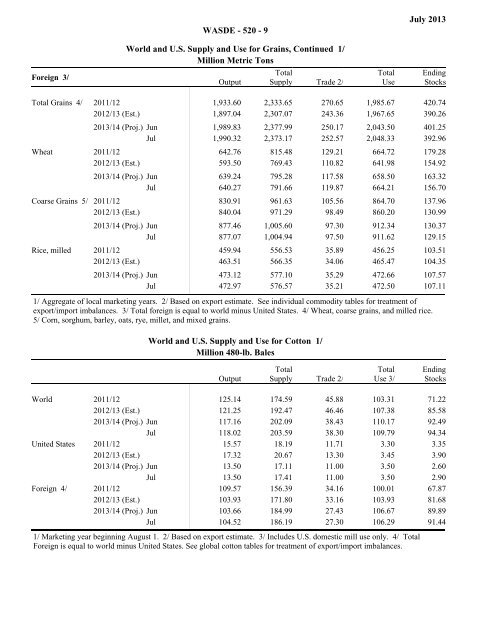
WASDE - 520 - 9July 2013<strong>World</strong> <strong>and</strong> U.S. <strong>Supply</strong> <strong>and</strong> Use for Grains, Continued 1/Million Metric TonsForeign 3/OutputTotal<strong>Supply</strong> Trade 2/TotalUseEndingStocksTotal Grains 4/ 2011/12 1,933.60 2,333.65 270.65 1,985.67 420.742012/13 (Est.) 1,897.04 2,307.07 243.36 1,967.65 390.262013/14 (Proj.) Junfiller1,989.83filler2,377.99filler250.17filler2,043.50filler401.252013/14 (Proj.) Jul 1,990.32 2,373.17 252.57 2,048.33 392.96Wheat 2011/12filler642.76filler815.48filler129.21filler664.72filler179.282012/13 (Est.) 593.50 769.43 110.82 641.98 154.922013/14 (Proj.) Junfiller639.24filler795.28filler117.58filler658.50filler163.322013/14 (Proj.) Jul 640.27 791.66 119.87 664.21 156.70Coarse Grains 5/ 2011/12filler830.91filler961.63filler105.56filler864.70filler137.962012/13 (Est.) 840.04 971.29 98.49 860.20 130.992013/14 (Proj.) Junfiller877.46filler1,005.60filler97.30filler912.34filler130.372013/14 (Proj.) Jul 877.07 1,004.94 97.50 911.62 129.15Rice, milled 2011/12filler459.94filler556.53filler35.89filler456.25filler103.512012/13 (Est.) 463.51 566.35 34.06 465.47 104.352013/14 (Proj.) Junfiller473.12filler577.10filler35.29filler472.66filler107.572013/14 (Proj.) Jul 472.97 576.57 35.21 472.50 107.11filler filler filler filler filler1/ Aggregate of local marketing years. 2/ Based on export estimate. See individual commodity tables for treatment ofexport/import imbalances. 3/ Total foreign is equal to world minus United States. 4/ Wheat, coarse grains, <strong>and</strong> milled rice.5/ Corn, sorghum, barley, oats, rye, millet, <strong>and</strong> mixed grains.<strong>World</strong> <strong>and</strong> U.S. <strong>Supply</strong> <strong>and</strong> Use for Cotton 1/Million 480-lb. BalesOutputTotal<strong>Supply</strong> Trade 2/TotalUse 3/EndingStocks<strong>World</strong> 2011/12 125.14 174.59 45.88 103.31 71.222012/13 (Est.) 121.25 192.47 46.46 107.38 85.582013/14 (Proj.) Jun 117.16 202.09 38.43 110.17 92.492013/14 (Proj.) Jul 118.02 203.59 38.30 109.79 94.34United States 2011/12 15.57 18.19 11.71 3.30 3.352012/13 (Est.) 17.32 20.67 13.30 3.45 3.902013/14 (Proj.) Jun 13.50 17.11 11.00 3.50 2.602013/14 (Proj.) Jul 13.50 17.41 11.00 3.50 2.90Foreign 4/ 2011/12 109.57 156.39 34.16 100.01 67.872012/13 (Est.) 103.93 171.80 33.16 103.93 81.682013/14 (Proj.) Jun 103.66 184.99 27.43 106.67 89.892013/14 (Proj.) Jul 104.52 186.19 27.30 106.29 91.441/ Marketing year beginning August 1. 2/ Based on export estimate. 3/ Includes U.S. domestic mill use only. 4/ TotalForeign is equal to world minus United States. See global cotton tables for treatment of export/import imbalances.