World Agricultural Supply and Demand Estimates
World Agricultural Supply and Demand Estimates
World Agricultural Supply and Demand Estimates

You also want an ePaper? Increase the reach of your titles
YUMPU automatically turns print PDFs into web optimized ePapers that Google loves.
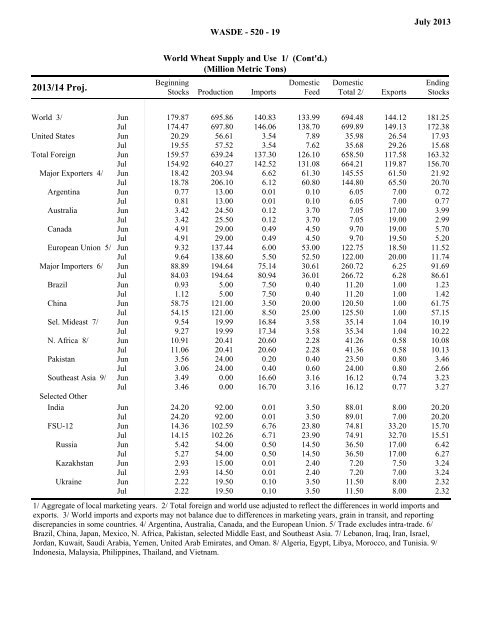
WASDE - 520 - 19July 2013<strong>World</strong> Wheat <strong>Supply</strong> <strong>and</strong> Use 1/ (Cont'd.)(Million Metric Tons)2013/14 Proj.BeginningStocks Production ImportsDomesticFeedDomesticTotal 2/ExportsEndingStocks<strong>World</strong> 3/ Jun 179.87 695.86 140.83 133.99 694.48 144.12 181.25Jul 174.47 697.80 146.06 138.70 699.89 149.13 172.38United States Jun 20.29 56.61 3.54 7.89 35.98 26.54 17.93Jul 19.55 57.52 3.54 7.62 35.68 29.26 15.68Total Foreign Jun 159.57 639.24 137.30 126.10 658.50 117.58 163.32Jul 154.92 640.27 142.52 131.08 664.21 119.87 156.70Major Exporters 4/ Jun 18.42 203.94 6.62 61.30 145.55 61.50 21.92Jul 18.78 206.10 6.12 60.80 144.80 65.50 20.70Argentina Jun 0.77 13.00 0.01 0.10 6.05 7.00 0.72Jul 0.81 13.00 0.01 0.10 6.05 7.00 0.77Australia Jun 3.42 24.50 0.12 3.70 7.05 17.00 3.99Jul 3.42 25.50 0.12 3.70 7.05 19.00 2.99Canada Jun 4.91 29.00 0.49 4.50 9.70 19.00 5.70Jul 4.91 29.00 0.49 4.50 9.70 19.50 5.20European Union 5/ Jun 9.32 137.44 6.00 53.00 122.75 18.50 11.52Jul 9.64 138.60 5.50 52.50 122.00 20.00 11.74Major Importers 6/ Jun 88.89 194.64 75.14 30.61 260.72 6.25 91.69Jul 84.03 194.64 80.94 36.01 266.72 6.28 86.61Brazil Jun 0.93 5.00 7.50 0.40 11.20 1.00 1.23Jul 1.12 5.00 7.50 0.40 11.20 1.00 1.42China Jun 58.75 121.00 3.50 20.00 120.50 1.00 61.75Jul 54.15 121.00 8.50 25.00 125.50 1.00 57.15Sel. Mideast 7/ Jun 9.54 19.99 16.84 3.58 35.14 1.04 10.19Jul 9.27 19.99 17.34 3.58 35.34 1.04 10.22N. Africa 8/ Jun 10.91 20.41 20.60 2.28 41.26 0.58 10.08Jul 11.06 20.41 20.60 2.28 41.36 0.58 10.13Pakistan Jun 3.56 24.00 0.20 0.40 23.50 0.80 3.46Jul 3.06 24.00 0.40 0.60 24.00 0.80 2.66Southeast Asia 9/ Jun 3.49 0.00 16.60 3.16 16.12 0.74 3.23Jul 3.46 0.00 16.70 3.16 16.12 0.77 3.27Selected OtherIndia Jun 24.20 92.00 0.01 3.50 88.01 8.00 20.20Jul 24.20 92.00 0.01 3.50 89.01 7.00 20.20FSU-12 Jun 14.36 102.59 6.76 23.80 74.81 33.20 15.70Jul 14.15 102.26 6.71 23.90 74.91 32.70 15.51Russia Jun 5.42 54.00 0.50 14.50 36.50 17.00 6.42Jul 5.27 54.00 0.50 14.50 36.50 17.00 6.27Kazakhstan Jun 2.93 15.00 0.01 2.40 7.20 7.50 3.24Jul 2.93 14.50 0.01 2.40 7.20 7.00 3.24Ukraine Jun 2.22 19.50 0.10 3.50 11.50 8.00 2.32Jul 2.22 19.50 0.10 3.50 11.50 8.00 2.321/ Aggregate of local marketing years. 2/ Total foreign <strong>and</strong> world use adjusted to reflect the differences in world imports <strong>and</strong>exports. 3/ <strong>World</strong> imports <strong>and</strong> exports may not balance due to differences in marketing years, grain in transit, <strong>and</strong> reportingdiscrepancies in some countries. 4/ Argentina, Australia, Canada, <strong>and</strong> the European Union. 5/ Trade excludes intra-trade. 6/Brazil, China, Japan, Mexico, N. Africa, Pakistan, selected Middle East, <strong>and</strong> Southeast Asia. 7/ Lebanon, Iraq, Iran, Israel,Jordan, Kuwait, Saudi Arabia, Yemen, United Arab Emirates, <strong>and</strong> Oman. 8/ Algeria, Egypt, Libya, Morocco, <strong>and</strong> Tunisia. 9/Indonesia, Malaysia, Philippines, Thail<strong>and</strong>, <strong>and</strong> Vietnam.