TotalWASDE - 520 - 16July 2013U.S. Sugar <strong>Supply</strong> <strong>and</strong> Use 1/2011/12 2012/13 Est. 2013/14 Proj. 2013/14 Proj.Filler Filler Filler Filler Filler1,000 Short Tons, Raw ValueBeginning Stocks 1,378 1,985 2,231 2,219Production 2/ 8,488 9,015 8,584 8,643Beet Sugar 4,900 5,100 4,840 4,890Cane Sugar 3,588 3,915 3,744 3,753Florida 1,828 1,866 1,833 1,833Hawaii 172 180 180 180Louisiana 1,438 1,700 1,561 1,600Texas 150 169 170 140Imports 3,631 3,024 3,810 3,116TRQ 3/ 1,883 989 1,265 1,122Other Program 4/ 664 125 400 125Other 5/ 1,084 1,910 2,145 1,869Mexico 1,071 1,900 2,135 1,859Total <strong>Supply</strong> 13,497 14,024 14,625 13,978Exports 269 200 200 200Deliveries 11,243 11,605 11,745 11,765Food 6/ 11,070 11,470 11,560 11,580Other 7/ 173 135 185 185Miscellaneous 0 0 0 0Total Use 11,512 11,805 11,945 11,965Ending Stocks 1,985 2,219 2,680 2,013Stocks to Use Ratio 17.2 18.8 22.4 16.8JunJul1/ Fiscal years beginning Oct 1. Historical data are from FSA "Sweetener Market Data". 2/ Production projections for 2013/14are based on June 28 Acreage report <strong>and</strong> trend yields. 3/ For 2013/14, includes only U.S. commitments under current tradeagreements, minus shortfall. The Secretary will establish the actual level of the TRQ at a later date. For 2012/13, WTO TRQshortfall (541). For 2013/14, WTO TRQ shortfall (350). 4/ Includes sugar under the re-export <strong>and</strong> polyhydric alcohol programs.5/ For 2011/12, other high-tier (13) <strong>and</strong> other (0). For 2012/13, other high-tier (10) <strong>and</strong> other (0). For 2013/14, other high-tier(10) <strong>and</strong> other (0). 6/Combines SMD deliveries for domestic human food use <strong>and</strong> SMD miscellaneous uses. 7/ Transfers tosugar-containing products for reexport, <strong>and</strong> for nonedible alcohol <strong>and</strong> feed.Mexico Sugar <strong>Supply</strong> <strong>and</strong> Use <strong>and</strong> High Fructose Corn Syrup Imports 1/BeginningStocks Production Imports Domestic 2/ ExportsEndingStocksSugar 1,000 Metric Tons, Actual Weight2012/13 Est. Jun 966 6,840 137 4,540 1,718 1,6852012/13 Est. Jul 966 6,990 137 4,775 1,811 1,5072013/14 Proj. Jun 1,685 5,887 137 4,600 1,937 1,1722013/14 Proj. Jul 1,507 5,887 137 4,840 1,701 9901/ HFCS imports by Mexico (1,000 metric tons, dry basis): Oct-Sep 2011/12 = 1,283; Oct-May 2011/12 = 832; Oct-May 2012/13= 738. Footnote source: Comite Nacional para el Desarollo Sustentable de la Cana de Azucar. 2/Includes domestic consumption,Mexico's products export program (IMMEX), <strong>and</strong> any residual statistical discrepancies. IMMEX: 2012/13 (340 est), 2013/14(340 proj).
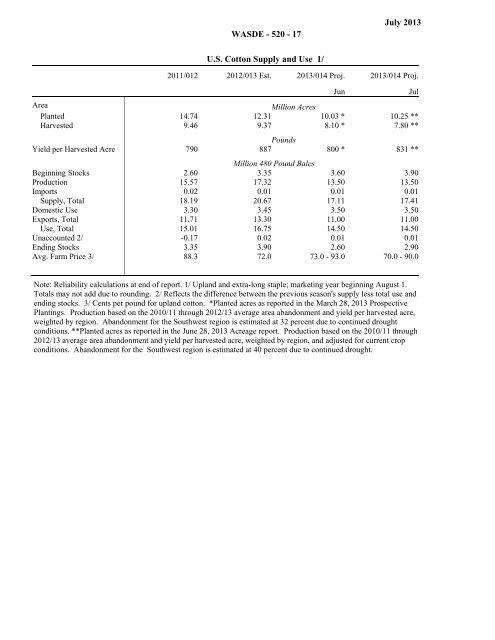
FillerTotalWASDE - 520 - 17July 2013U.S. Cotton <strong>Supply</strong> <strong>and</strong> Use 1/2011/012 2012/013 Est. 2013/014 Proj. 2013/014 Proj.Filler Filler Filler Filler FillerArea Million AcresPlanted 14.74 12.31 10.03 * 10.25 **Harvested 9.46 9.37 8.10 * 7.80 **PoundsYield per Harvested Acre 790 887 800 * 831 **Million 480 Pound BalesBeginning Stocks 2.60 3.35 3.60 3.90Production 15.57 17.32 13.50 13.50Imports 0.02 0.01 0.01 0.01<strong>Supply</strong>, Total 18.19 20.67 17.11 17.41Domestic Use 3.30 3.45 3.50 3.50Exports, Total 11.71 13.30 11.00 11.00Use, Total 15.01 16.75 14.50 14.50Unaccounted 2/ -0.17 0.02 0.01 0.01Ending Stocks 3.35 3.90 2.60 2.90Avg. Farm Price 3/ 88.3 72.0 73.0 - 93.0 70.0 - 90.0JunJulNote: Reliability calculations at end of report. 1/ Upl<strong>and</strong> <strong>and</strong> extra-long staple; marketing year beginning August 1.Totals may not add due to rounding. 2/ Reflects the difference between the previous season's supply less total use <strong>and</strong>ending stocks. 3/ Cents per pound for upl<strong>and</strong> cotton. *Planted acres as reported in the March 28, 2013 ProspectivePlantings. Production based on the 2010/11 through 2012/13 average area ab<strong>and</strong>onment <strong>and</strong> yield per harvested acre,weighted by region. Ab<strong>and</strong>onment for the Southwest region is estimated at 32 percent due to continued droughtconditions. **Planted acres as reported in the June 28, 2013 Acreage report. Production based on the 2010/11 through2012/13 average area ab<strong>and</strong>onment <strong>and</strong> yield per harvested acre, weighted by region, <strong>and</strong> adjusted for current cropconditions. Ab<strong>and</strong>onment for the Southwest region is estimated at 40 percent due to continued drought.