World Agricultural Supply and Demand Estimates
World Agricultural Supply and Demand Estimates
World Agricultural Supply and Demand Estimates

Create successful ePaper yourself
Turn your PDF publications into a flip-book with our unique Google optimized e-Paper software.
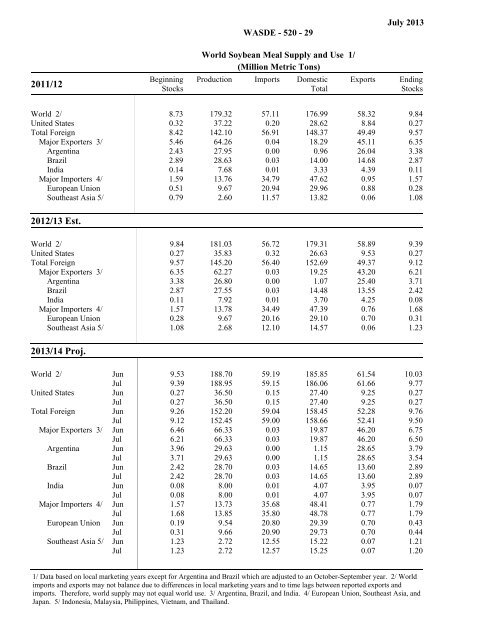
BeginningStocksProduction Imports DomesticTotalDomesticTotalExportsortsExpEndingStocksEndingStocksWASDE - 520 - 29July 2013<strong>World</strong> Soybean Meal <strong>Supply</strong> <strong>and</strong> Use 1/(Million Metric Tons)2011/12BeginningStocksProduction Imports DomesticTotalExportsEndingStocks<strong>World</strong> 2/ 8.73 179.32 57.11 176.99 58.32 9.84United States 0.32 37.22 0.20 28.62 8.84 0.27Total Foreign 8.42 142.10 56.91 148.37 49.49 9.57Major Exporters 3/ 5.46 64.26 0.04 18.29 45.11 6.35Argentina 2.43 27.95 0.00 0.96 26.04 3.38Brazil 2.89 28.63 0.03 14.00 14.68 2.87India 0.14 7.68 0.01 3.33 4.39 0.11Major Importers 4/ 1.59 13.76 34.79 47.62 0.95 1.57European Union 0.51 9.67 20.94 29.96 0.88 0.28Southeast Asia 5/ 0.79 2.60 11.57 13.82 0.06 1.082012/13 Est.BeginningStocks Production Imports<strong>World</strong> 2/ 9.84 181.03 56.72 179.31 58.89 9.39United States 0.27 35.83 0.32 26.63 9.53 0.27Total Foreign 9.57 145.20 56.40 152.69 49.37 9.12Major Exporters 3/ 6.35 62.27 0.03 19.25 43.20 6.21Argentina 3.38 26.80 0.00 1.07 25.40 3.71Brazil 2.87 27.55 0.03 14.48 13.55 2.42India 0.11 7.92 0.01 3.70 4.25 0.08Major Importers 4/ 1.57 13.78 34.49 47.39 0.76 1.68European Union 0.28 9.67 20.16 29.10 0.70 0.31Southeast Asia 5/ 1.08 2.68 12.10 14.57 0.06 1.232013/14 Proj.<strong>World</strong> 2/ Jun 9.53 188.70 59.19 185.85 61.54 10.03Jul 9.39 188.95 59.15 186.06 61.66 9.77United States Jun 0.27 36.50 0.15 27.40 9.25 0.27Jul 0.27 36.50 0.15 27.40 9.25 0.27Total Foreign Jun 9.26 152.20 59.04 158.45 52.28 9.76Jul 9.12 152.45 59.00 158.66 52.41 9.50Major Exporters 3/ Jun 6.46 66.33 0.03 19.87 46.20 6.75Jul 6.21 66.33 0.03 19.87 46.20 6.50Argentina Jun 3.96 29.63 0.00 1.15 28.65 3.79Jul 3.71 29.63 0.00 1.15 28.65 3.54Brazil Jun 2.42 28.70 0.03 14.65 13.60 2.89Jul 2.42 28.70 0.03 14.65 13.60 2.89India Jun 0.08 8.00 0.01 4.07 3.95 0.07Jul 0.08 8.00 0.01 4.07 3.95 0.07Major Importers 4/ Jun 1.57 13.73 35.68 48.41 0.77 1.79Jul 1.68 13.85 35.80 48.78 0.77 1.79European Union Jun 0.19 9.54 20.80 29.39 0.70 0.43Jul 0.31 9.66 20.90 29.73 0.70 0.44Southeast Asia 5/ Jun 1.23 2.72 12.55 15.22 0.07 1.21Jul 1.23 2.72 12.57 15.25 0.07 1.201/ Data based on local marketing years except for Argentina <strong>and</strong> Brazil which are adjusted to an October-September year. 2/ <strong>World</strong>imports <strong>and</strong> exports may not balance due to differences in local marketing years <strong>and</strong> to time lags between reported exports <strong>and</strong>imports. Therefore, world supply may not equal world use. 3/ Argentina, Brazil, <strong>and</strong> India. 4/ European Union, Southeast Asia, <strong>and</strong>Japan. 5/ Indonesia, Malaysia, Philippines, Vietnam, <strong>and</strong> Thail<strong>and</strong>.