World Agricultural Supply and Demand Estimates
World Agricultural Supply and Demand Estimates
World Agricultural Supply and Demand Estimates

You also want an ePaper? Increase the reach of your titles
YUMPU automatically turns print PDFs into web optimized ePapers that Google loves.
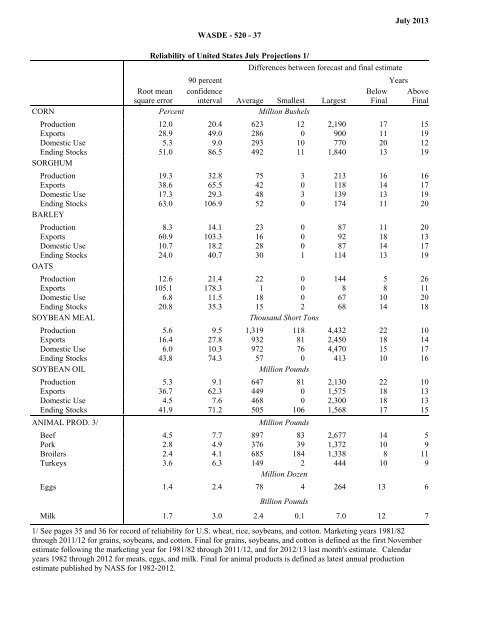
WASDE - 520 - 37July 2013Reliability of United States July Projections 1/Differences between forecast <strong>and</strong> final estimate90 percent YearsRoot meansquare errorconfidenceinterval Average Smallest LargestBelowFinalAboveFinalCORN Percent Million BushelsProduction 12.0 20.4 623 12 2,190 17 15Exports 28.9 49.0 286 0 900 11 19Domestic Use 5.3 9.0 293 10 770 20 12Ending Stocks 51.0 86.5 492 11 1,840 13 19SORGHUMProduction 19.3 32.8 75 3 213 16 16Exports 38.6 65.5 42 0 118 14 17Domestic Use 17.3 29.3 48 3 139 13 19Ending Stocks 63.0 106.9 52 0 174 11 20BARLEYProduction 8.3 14.1 23 0 87 11 20Exports 60.9 103.3 16 0 92 18 13Domestic Use 10.7 18.2 28 0 87 14 17Ending Stocks 24.0 40.7 30 1 114 13 19OATSProduction 12.6 21.4 22 0 144 5 26Exports 105.1 178.3 1 0 8 8 11Domestic Use 6.8 11.5 18 0 67 10 20Ending Stocks 20.8 35.3 15 2 68 14 18SOYBEAN MEAL Thous<strong>and</strong> Short TonsProduction 5.6 9.5 1,319 118 4,432 22 10Exports 16.4 27.8 932 81 2,450 18 14Domestic Use 6.0 10.3 972 76 4,470 15 17Ending Stocks 43.8 74.3 57 0 413 10 16SOYBEAN OIL Million PoundsProduction 5.3 9.1 647 81 2,130 22 10Exports 36.7 62.3 449 0 1,575 18 13Domestic Use 4.5 7.6 468 0 2,300 18 13Ending Stocks 41.9 71.2 505 106 1,568 17 15ANIMAL PROD. 3/ Million PoundsBeef 4.5 7.7 897 83 2,677 14 5Pork 2.8 4.9 376 39 1,372 10 9Broilers 2.4 4.1 685 184 1,338 8 11Turkeys 3.6 6.3 149 2 444 10 9Million DozenEggs 1.4 2.4 78 4 264 13 6Billion PoundsMilk 1.7 3.0 2.4 0.1 7.0 12 71/ See pages 35 <strong>and</strong> 36 for record of reliability for U.S. wheat, rice, soybeans, <strong>and</strong> cotton. Marketing years 1981/82through 2011/12 for grains, soybeans, <strong>and</strong> cotton. Final for grains, soybeans, <strong>and</strong> cotton is defined as the first Novemberestimate following the marketing year for 1981/82 through 2011/12, <strong>and</strong> for 2012/13 last month's estimate. Calendaryears 1982 through 2012 for meats, eggs, <strong>and</strong> milk. Final for animal products is defined as latest annual productionestimate published by NASS for 1982-2012.