World Agricultural Supply and Demand Estimates
World Agricultural Supply and Demand Estimates
World Agricultural Supply and Demand Estimates

You also want an ePaper? Increase the reach of your titles
YUMPU automatically turns print PDFs into web optimized ePapers that Google loves.
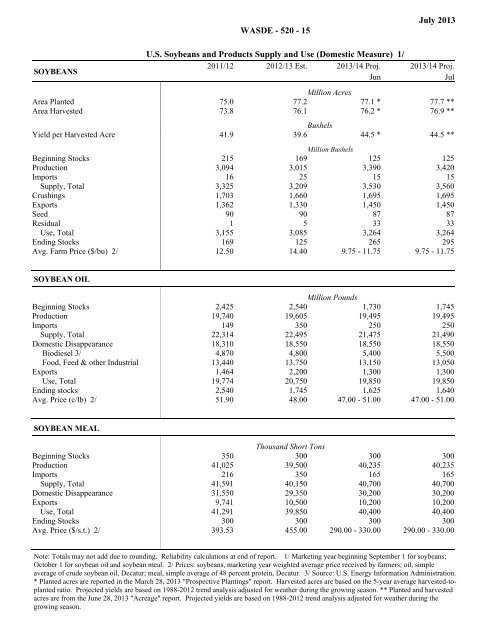
FillerTotalTotalTotal12/2011. Est 13/ 2012. Proj 14/ 2013.Proj 14/ 201312/2011. Est 13/ 2012. Proj 14/ 2013.Proj 14/ 2013JuneJuneJulyJulyWASDE - 520 - 15July 2013SOYBEANSU.S. Soybeans <strong>and</strong> Products <strong>Supply</strong> <strong>and</strong> Use (Domestic Measure) 1/2011/12 2012/13 Est. 2013/14 Proj. 2013/14 Proj.JunJulFiller Filler Filler Filler FillerMillion AcresArea Planted 75.0 77.2 77.1 * 77.7 **Area Harvested 73.8 76.1 76.2 * 76.9 **BushelsYield per Harvested Acre 41.9 39.6 44.5 * 44.5 **Million BushelsBeginning Stocks 215 169 125 125Production 3,094 3,015 3,390 3,420Imports 16 25 15 15<strong>Supply</strong>, Total 3,325 3,209 3,530 3,560Crushings 1,703 1,660 1,695 1,695Exports 1,362 1,330 1,450 1,450Seed 90 90 87 87Residual 1 5 33 33Use, Total 3,155 3,085 3,264 3,264Ending Stocks 169 125 265 295Avg. Farm Price ($/bu) 2/ 12.50 14.40 9.75 - 11.75 9.75 - 11.75SOYBEAN OILFiller Filler Filler Filler FillerMillion PoundsBeginning Stocks 2,425 2,540 1,730 1,745Production 19,740 19,605 19,495 19,495Imports 149 350 250 250<strong>Supply</strong>, Total 22,314 22,495 21,475 21,490Domestic Disappearance 18,310 18,550 18,550 18,550Biodiesel 3/ 4,870 4,800 5,400 5,500Food, Feed & other Industrial 13,440 13,750 13,150 13,050Exports 1,464 2,200 1,300 1,300Use, Total 19,774 20,750 19,850 19,850Ending stocks 2,540 1,745 1,625 1,640Avg. Price (c/lb) 2/ 51.90 48.00 47.00 - 51.00 47.00 - 51.00SOYBEAN MEALFiller 1 2 3 4Thous<strong>and</strong> Short TonsBeginning Stocks 350 300 300 300Production 41,025 39,500 40,235 40,235Imports 216 350 165 165<strong>Supply</strong>, Total 41,591 40,150 40,700 40,700Domestic Disappearance 31,550 29,350 30,200 30,200Exports 9,741 10,500 10,200 10,200Use, Total 41,291 39,850 40,400 40,400Ending Stocks 300 300 300 300Avg. Price ($/s.t.) 2/ 393.53 455.00 290.00 - 330.00 290.00 - 330.00Note: Totals may not add due to rounding. Reliability calculations at end of report. 1/ Marketing year beginning September 1 for soybeans;October 1 for soybean oil <strong>and</strong> soybean meal. 2/ Prices: soybeans, marketing year weighted average price received by farmers; oil, simpleaverage of crude soybean oil, Decatur; meal, simple average of 48 percent protein, Decatur. 3/ Source: U.S. Energy Information Administration.* Planted acres are reported in the March 28, 2013 "Prospective Plantings" report. Harvested acres are based on the 5-year average harvested-toplantedratio. Projected yields are based on 1988-2012 trend analysis adjusted for weather during the growing season. ** Planted <strong>and</strong> harvestedacres are from the June 28, 2013 "Acreage" report. Projected yields are based on 1988-2012 trend analysis adjusted for weather during thegrowing season.