World Agricultural Supply and Demand Estimates
World Agricultural Supply and Demand Estimates
World Agricultural Supply and Demand Estimates

You also want an ePaper? Increase the reach of your titles
YUMPU automatically turns print PDFs into web optimized ePapers that Google loves.
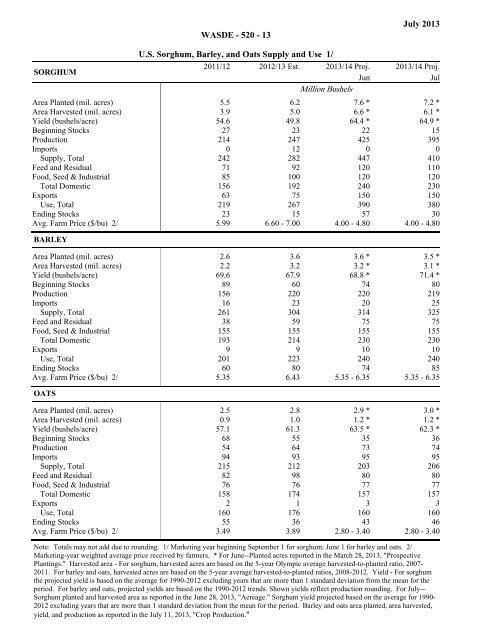
Filler Filler Filler Filler Filler12/2011. Est 13/ 2012. Proj 14/ 2013.Proj 14/ 2013Filler Filler Filler Filler Filler12/2011. Est 13/ 2012. Proj 14/ 2013.Proj 14/ 2013Filler Filler Filler Filler FillerJuneJuneJulyJulyWASDE - 520 - 13July 2013SORGHUMU.S. Sorghum, Barley, <strong>and</strong> Oats <strong>Supply</strong> <strong>and</strong> Use 1/2011/12 2012/13 Est. 2013/14 Proj. 2013/14 Proj.JunJulMillion BushelsFiller Filler Filler Filler FillerArea Planted (mil. acres) 5.5 6.2 7.6 * 7.2 *Area Harvested (mil. acres) 3.9 5.0 6.6 * 6.1 *Yield (bushels/acre) 54.6 49.8 64.4 * 64.9 *Beginning Stocks 27 23 22 15Production 214 247 425 395Imports 0 12 0 0<strong>Supply</strong>, Total 242 282 447 410Feed <strong>and</strong> Residual 71 92 120 110Food, Seed & Industrial 85 100 120 120Total Domestic 156 192 240 230Exports 63 75 150 150Use, Total 219 267 390 380Ending Stocks 23 15 57 30Avg. Farm Price ($/bu) 2/ 5.99 6.60 - 7.00 4.00 - 4.80 4.00 - 4.80BARLEYFiller Filler Filler Filler FillerArea Planted (mil. acres) 2.6 3.6 3.6 * 3.5 *Area Harvested (mil. acres) 2.2 3.2 3.2 * 3.1 *Yield (bushels/acre) 69.6 67.9 68.8 * 71.4 *Beginning Stocks 89 60 74 80Production 156 220 220 219Imports 16 23 20 25<strong>Supply</strong>, Total 261 304 314 325Feed <strong>and</strong> Residual 38 59 75 75Food, Seed & Industrial 155 155 155 155Total Domestic 193 214 230 230Exports 9 9 10 10Use, Total 201 223 240 240Ending Stocks 60 80 74 85Avg. Farm Price ($/bu) 2/ 5.35 6.43 5.35 - 6.35 5.35 - 6.35OATSFiller Filler Filler Filler FillerArea Planted (mil. acres) 2.5 2.8 2.9 * 3.0 *Area Harvested (mil. acres) 0.9 1.0 1.2 * 1.2 *Yield (bushels/acre) 57.1 61.3 63.5 * 62.3 *Beginning Stocks 68 55 35 36Production 54 64 73 74Imports 94 93 95 95<strong>Supply</strong>, Total 215 212 203 206Feed <strong>and</strong> Residual 82 98 80 80Food, Seed & Industrial 76 76 77 77Total Domestic 158 174 157 157Exports 2 1 3 3Use, Total 160 176 160 160Ending Stocks 55 36 43 46Avg. Farm Price ($/bu) 2/ 3.49 3.89 2.80 - 3.40 2.80 - 3.40Note: Totals may not add due to rounding. 1/ Marketing year beginning September 1 for sorghum; June 1 for barley <strong>and</strong> oats. 2/Marketing-year weighted average price received by farmers. * For June--Planted acres reported in the March 28, 2013, "ProspectivePlantings." Harvested area - For sorghum, harvested acres are based on the 5-year Olympic average harvested-to-planted ratio, 2007-2011. For barley <strong>and</strong> oats, harvested acres are based on the 5-year average harvested-to-planted ratios, 2008-2012. Yield - For sorghumthe projected yield is based on the average for 1990-2012 excluding years that are more than 1 st<strong>and</strong>ard deviation from the mean for theperiod. For barley <strong>and</strong> oats, projected yields are based on the 1990-2012 trends. Shown yields reflect production rounding. For July--Sorghum planted <strong>and</strong> harvested area as reported in the June 28, 2013, "Acreage." Sorghum yield projected based on the average for 1990-2012 excluding years that are more than 1 st<strong>and</strong>ard deviation from the mean for the period. Barley <strong>and</strong> oats area planted, area harvested,yield, <strong>and</strong> production as reported in the July 11, 2013, "Crop Production."