Filler Filler Filler Filler Filler Filler Filler FillerFiller Filler Filler Filler Filler Filler Filler FillerFiller Filler Filler Filler Filler Filler Filler FillerFiller Filler Filler Filler Filler Filler Filler FillerFiller Filler Filler Filler Filler Filler Filler FillerFiller Filler Filler Filler Filler Filler Filler FillerWASDE - 520 - 32July 2013U.S. Meats <strong>Supply</strong> <strong>and</strong> UseItemBeginningstocks Production1/ ImportsTotal<strong>Supply</strong>ExportsEndingStocksTotalUsePer Capita2/ 3/Million Pounds /4Beef 2012 600 25,996 2,219 28,815 2,455 608 25,752 57.42013 Proj. Jun 608 25,520 2,555 28,683 2,312 550 25,821 57.1Jul 608 25,420 2,400 28,428 2,312 550 25,566 56.52014 Proj. Jun 550 24,188 2,800 27,538 2,300 525 24,713 54.3Jul 550 24,188 2,740 27,478 2,300 525 24,653 54.1Pork 2012 542 23,270 801 24,613 5,384 625 18,604 45.92013 Proj. Jun 625 23,444 797 24,866 5,028 650 19,188 47.0Jul 625 23,419 817 24,861 5,028 650 19,183 47.02014 Proj. Jun 650 24,042 800 25,492 5,255 675 19,562 47.6Jul 650 24,152 820 25,622 5,255 675 19,692 47.9Total RedMeat 5/2012 1,162 49,552 3,173 53,887 7,850 1,259 44,779 104.52013 Proj. Jun 1,259 49,244 3,522 54,025 7,354 1,226 45,445 105.3Jul 1,259 49,118 3,387 53,764 7,354 1,225 45,185 104.82014 Proj. Jun 1,226 48,502 3,764 53,492 7,571 1,225 44,696 103.0Jul 1,225 48,612 3,724 53,561 7,571 1,224 44,766 103.2Broiler 2012 590 36,643 112 37,345 7,281 651 29,413 80.42013 Proj. Jun 651 37,364 114 38,129 7,359 635 30,135 81.8Jul 651 37,364 114 38,129 7,459 635 30,035 81.52014 Proj. Jun 635 38,434 112 39,181 7,550 640 30,991 83.5Jul 635 38,434 112 39,181 7,550 640 30,991 83.5Turkey 2012 211 5,889 23 6,123 800 296 5,027 16.02013 Proj. Jun 296 5,881 21 6,198 713 300 5,185 16.4Jul 296 5,841 21 6,158 733 300 5,125 16.22014 Proj. Jun 300 6,175 20 6,495 840 310 5,345 16.8Jul 300 6,175 20 6,495 840 310 5,345 16.8TotalPoultry 6/Red Meat &Poultry2012 803 43,049 137 43,989 8,171 948 34,870 97.82013 Proj. Jun 948 43,758 136 44,842 8,169 937 35,737 99.5Jul 948 43,719 136 44,803 8,304 938 35,561 99.02014 Proj. Jun 937 45,144 134 46,215 8,500 952 36,763 101.6Jul 938 45,144 134 46,216 8,500 952 36,764 101.62012 1,965 92,601 3,310 97,876 16,021 2,207 79,649 202.22013 Proj. Jun 2,207 93,002 3,658 98,867 15,523 2,163 81,181 204.8Jul 2,207 92,837 3,523 98,567 15,658 2,163 80,746 203.72014 Proj. Jun 2,163 93,646 3,898 99,707 16,071 2,177 81,459 204.6Jul 2,163 93,756 3,858 99,777 16,071 2,176 81,530 204.81/ Total including farm production for red meats <strong>and</strong>, for poultry, federally inspected plus non-federally inspected, lesscondemnations. 2/ Pounds, retail-weight basis. 3/ Population source: Dept. of Commerce, Census Bureau. 4/ Carcass weight forred meats <strong>and</strong> certified ready-to-cook weight for poultry. 5/ Beef, pork, veal, lamb <strong>and</strong> mutton. 6/ Broilers, turkeys <strong>and</strong> maturechicken.
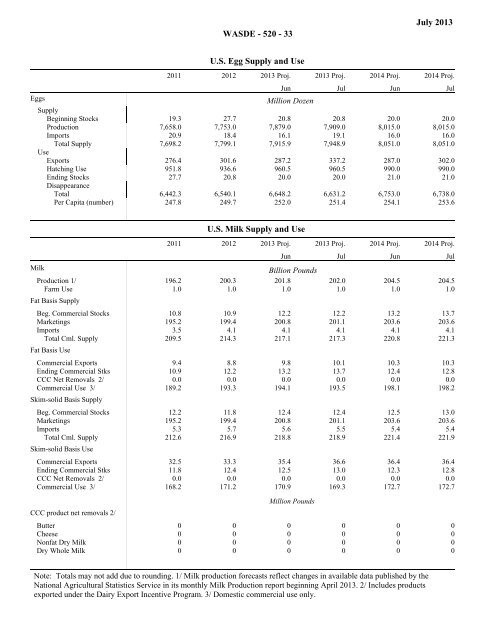
TotalFillerTotalWASDE - 520 - 33July 2013U.S. Egg <strong>Supply</strong> <strong>and</strong> Use2011 2012 2013 Proj. 2013 Proj. 2014 Proj. 2014 Proj.CommodityJun Jul Jun JulEggs Million Dozen<strong>Supply</strong>Beginning Stocks 19.3 27.7 20.8 20.8 20.0 20.0Production 7,658.0 7,753.0 7,879.0 7,909.0 8,015.0 8,015.0Imports 20.9 18.4 16.1 19.1 16.0 16.0Total <strong>Supply</strong> 7,698.2 7,799.1 7,915.9 7,948.9 8,051.0 8,051.0UseExports 276.4 301.6 287.2 337.2 287.0 302.0Hatching Use 951.8 936.6 960.5 960.5 990.0 990.0Ending Stocks 27.7 20.8 20.0 20.0 21.0 21.0DisappearanceTotal 6,442.3 6,540.1 6,648.2 6,631.2 6,753.0 6,738.0Per Capita (number) 247.8 249.7 252.0 251.4 254.1 253.6U.S. Milk <strong>Supply</strong> <strong>and</strong> UseCommodity2011 2012 2013 Proj. 2013 Proj. 2014 Proj. 2014 Proj.Jun Jul Jun JulMilk Billion PoundsProduction 1/ 196.2 200.3 201.8 202.0 204.5 204.5Farm Use 1.0 1.0 1.0 1.0 1.0 1.0Fat Basis <strong>Supply</strong>Beg. Commercial Stocks 10.8 10.9 12.2 12.2 13.2 13.7Marketings 195.2 199.4 200.8 201.1 203.6 203.6Imports 3.5 4.1 4.1 4.1 4.1 4.1Total Cml. <strong>Supply</strong> 209.5 214.3 217.1 217.3 220.8 221.3Fat Basis UseCommercial Exports 9.4 8.8 9.8 10.1 10.3 10.3Ending Commercial Stks 10.9 12.2 13.2 13.7 12.4 12.8CCC Net Removals 2/ 0.0 0.0 0.0 0.0 0.0 0.0Commercial Use 3/ 189.2 193.3 194.1 193.5 198.1 198.2Skim-solid Basis <strong>Supply</strong>Beg. Commercial Stocks 12.2 11.8 12.4 12.4 12.5 13.0Marketings 195.2 199.4 200.8 201.1 203.6 203.6Imports 5.3 5.7 5.6 5.5 5.4 5.4Total Cml. <strong>Supply</strong> 212.6 216.9 218.8 218.9 221.4 221.9Skim-solid Basis UseCommercial Exports 32.5 33.3 35.4 36.6 36.4 36.4Ending Commercial Stks 11.8 12.4 12.5 13.0 12.3 12.8CCC Net Removals 2/ 0.0 0.0 0.0 0.0 0.0 0.0Commercial Use 3/ 168.2 171.2 170.9 169.3 172.7 172.7CCC product net removals 2/Million PoundsButter 0 0 0 0 0 0Cheese 0 0 0 0 0 0Nonfat Dry Milk 0 0 0 0 0 0Dry Whole Milk 0 0 0 0 0 0Note: Totals may not add due to rounding. 1/ Milk production forecasts reflect changes in available data published by theNational <strong>Agricultural</strong> Statistics Service in its monthly Milk Production report beginning April 2013. 2/ Includes productsexported under the Dairy Export Incentive Program. 3/ Domestic commercial use only.