World Agricultural Supply and Demand Estimates
World Agricultural Supply and Demand Estimates
World Agricultural Supply and Demand Estimates

Create successful ePaper yourself
Turn your PDF publications into a flip-book with our unique Google optimized e-Paper software.
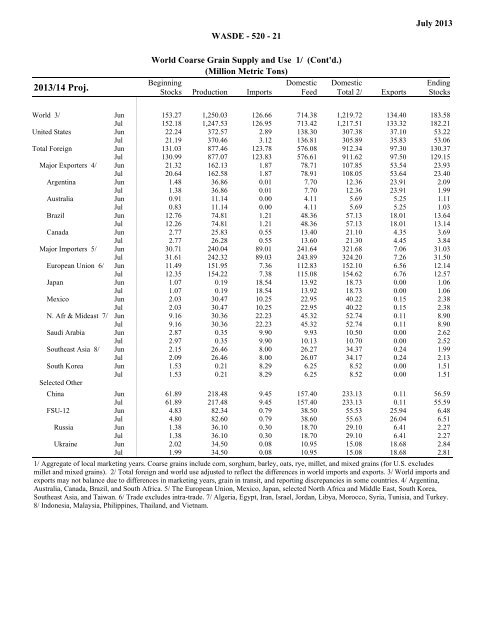
WASDE - 520 - 21July 20132013/14 Proj.<strong>World</strong> Coarse Grain <strong>Supply</strong> <strong>and</strong> Use 1/ (Cont'd.)(Million Metric Tons)BeginningDomestic DomesticStocks Production Imports Feed Total 2/ExportsEndingStocks<strong>World</strong> 3/ Jun 153.27 1,250.03 126.66 714.38 1,219.72 134.40 183.58Jul 152.18 1,247.53 126.95 713.42 1,217.51 133.32 182.21United States Jun 22.24 372.57 2.89 138.30 307.38 37.10 53.22Jul 21.19 370.46 3.12 136.81 305.89 35.83 53.06Total Foreign Jun 131.03 877.46 123.78 576.08 912.34 97.30 130.37Jul 130.99 877.07 123.83 576.61 911.62 97.50 129.15Major Exporters 4/ Jun 21.32 162.13 1.87 78.71 107.85 53.54 23.93Jul 20.64 162.58 1.87 78.91 108.05 53.64 23.40Argentina Jun 1.48 36.86 0.01 7.70 12.36 23.91 2.09Jul 1.38 36.86 0.01 7.70 12.36 23.91 1.99Australia Jun 0.91 11.14 0.00 4.11 5.69 5.25 1.11Jul 0.83 11.14 0.00 4.11 5.69 5.25 1.03Brazil Jun 12.76 74.81 1.21 48.36 57.13 18.01 13.64Jul 12.26 74.81 1.21 48.36 57.13 18.01 13.14Canada Jun 2.77 25.83 0.55 13.40 21.10 4.35 3.69Jul 2.77 26.28 0.55 13.60 21.30 4.45 3.84Major Importers 5/ Jun 30.71 240.04 89.01 241.64 321.68 7.06 31.03Jul 31.61 242.32 89.03 243.89 324.20 7.26 31.50European Union 6/ Jun 11.49 151.95 7.36 112.83 152.10 6.56 12.14Jul 12.35 154.22 7.38 115.08 154.62 6.76 12.57Japan Jun 1.07 0.19 18.54 13.92 18.73 0.00 1.06Jul 1.07 0.19 18.54 13.92 18.73 0.00 1.06Mexico Jun 2.03 30.47 10.25 22.95 40.22 0.15 2.38Jul 2.03 30.47 10.25 22.95 40.22 0.15 2.38N. Afr & Mideast 7/ Jun 9.16 30.36 22.23 45.32 52.74 0.11 8.90Jul 9.16 30.36 22.23 45.32 52.74 0.11 8.90Saudi Arabia Jun 2.87 0.35 9.90 9.93 10.50 0.00 2.62Jul 2.97 0.35 9.90 10.13 10.70 0.00 2.52Southeast Asia 8/ Jun 2.15 26.46 8.00 26.27 34.37 0.24 1.99Jul 2.09 26.46 8.00 26.07 34.17 0.24 2.13South Korea Jun 1.53 0.21 8.29 6.25 8.52 0.00 1.51Jul 1.53 0.21 8.29 6.25 8.52 0.00 1.51Selected OtherChina Jun 61.89 218.48 9.45 157.40 233.13 0.11 56.59Jul 61.89 217.48 9.45 157.40 233.13 0.11 55.59FSU-12 Jun 4.83 82.34 0.79 38.50 55.53 25.94 6.48Jul 4.80 82.60 0.79 38.60 55.63 26.04 6.51Russia Jun 1.38 36.10 0.30 18.70 29.10 6.41 2.27Jul 1.38 36.10 0.30 18.70 29.10 6.41 2.27Ukraine Jun 2.02 34.50 0.08 10.95 15.08 18.68 2.84Jul 1.99 34.50 0.08 10.95 15.08 18.68 2.811/ Aggregate of local marketing years. Coarse grains include corn, sorghum, barley, oats, rye, millet, <strong>and</strong> mixed grains (for U.S. excludesmillet <strong>and</strong> mixed grains). 2/ Total foreign <strong>and</strong> world use adjusted to reflect the differences in world imports <strong>and</strong> exports. 3/ <strong>World</strong> imports <strong>and</strong>exports may not balance due to differences in marketing years, grain in transit, <strong>and</strong> reporting discrepancies in some countries. 4/ Argentina,Australia, Canada, Brazil, <strong>and</strong> South Africa. 5/ The European Union, Mexico, Japan, selected North Africa <strong>and</strong> Middle East, South Korea,Southeast Asia, <strong>and</strong> Taiwan. 6/ Trade excludes intra-trade. 7/ Algeria, Egypt, Iran, Israel, Jordan, Libya, Morocco, Syria, Tunisia, <strong>and</strong> Turkey.8/ Indonesia, Malaysia, Philippines, Thail<strong>and</strong>, <strong>and</strong> Vietnam.