World Agricultural Supply and Demand Estimates
World Agricultural Supply and Demand Estimates
World Agricultural Supply and Demand Estimates

You also want an ePaper? Increase the reach of your titles
YUMPU automatically turns print PDFs into web optimized ePapers that Google loves.
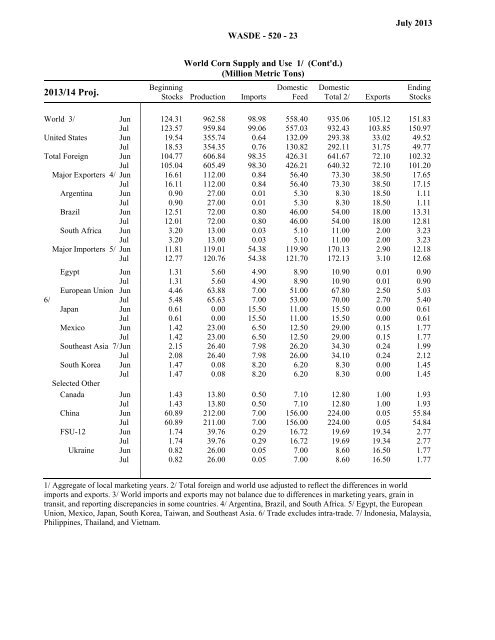
WASDE - 520 - 23July 2013<strong>World</strong> Corn <strong>Supply</strong> <strong>and</strong> Use 1/ (Cont'd.)(Million Metric Tons)2013/14 Proj.BeginningStocks Production ImportsDomesticFeedDomesticTotal 2/ExportsEndingStocks<strong>World</strong> 3/ Jun 124.31 962.58 98.98 558.40 935.06 105.12 151.83Jul 123.57 959.84 99.06 557.03 932.43 103.85 150.97United States Jun 19.54 355.74 0.64 132.09 293.38 33.02 49.52Jul 18.53 354.35 0.76 130.82 292.11 31.75 49.77Total Foreign Jun 104.77 606.84 98.35 426.31 641.67 72.10 102.32Jul 105.04 605.49 98.30 426.21 640.32 72.10 101.20Major Exporters 4/ Jun 16.61 112.00 0.84 56.40 73.30 38.50 17.65Jul 16.11 112.00 0.84 56.40 73.30 38.50 17.15Argentina Jun 0.90 27.00 0.01 5.30 8.30 18.50 1.11Jul 0.90 27.00 0.01 5.30 8.30 18.50 1.11Brazil Jun 12.51 72.00 0.80 46.00 54.00 18.00 13.31Jul 12.01 72.00 0.80 46.00 54.00 18.00 12.81South Africa Jun 3.20 13.00 0.03 5.10 11.00 2.00 3.23Jul 3.20 13.00 0.03 5.10 11.00 2.00 3.23Major Importers 5/ Jun 11.81 119.01 54.38 119.90 170.13 2.90 12.18Jul 12.77 120.76 54.38 121.70 172.13 3.10 12.68filler filler filler filler filler filler fillerEgypt Jun 1.31 5.60 4.90 8.90 10.90 0.01 0.906/European UnionJul 1.31 5.60 4.90 8.90 10.90 0.01 0.90Jun 4.46 63.88 7.00 51.00 67.80 2.50 5.03Jul 5.48 65.63 7.00 53.00 70.00 2.70 5.40Japan Jun 0.61 0.00 15.50 11.00 15.50 0.00 0.61Jul 0.61 0.00 15.50 11.00 15.50 0.00 0.61Mexico Jun 1.42 23.00 6.50 12.50 29.00 0.15 1.77Jul 1.42 23.00 6.50 12.50 29.00 0.15 1.77Southeast Asia 7/ Jun 2.15 26.40 7.98 26.20 34.30 0.24 1.99Jul 2.08 26.40 7.98 26.00 34.10 0.24 2.12South Korea Jun 1.47 0.08 8.20 6.20 8.30 0.00 1.45Jul 1.47 0.08 8.20 6.20 8.30 0.00 1.45Selected OtherCanada Jun 1.43 13.80 0.50 7.10 12.80 1.00 1.93Jul 1.43 13.80 0.50 7.10 12.80 1.00 1.93China Jun 60.89 212.00 7.00 156.00 224.00 0.05 55.84Jul 60.89 211.00 7.00 156.00 224.00 0.05 54.84FSU-12 Jun 1.74 39.76 0.29 16.72 19.69 19.34 2.77Jul 1.74 39.76 0.29 16.72 19.69 19.34 2.77Ukraine Jun 0.82 26.00 0.05 7.00 8.60 16.50 1.77Jul 0.82 26.00 0.05 7.00 8.60 16.50 1.771/ Aggregate of local marketing years. 2/ Total foreign <strong>and</strong> world use adjusted to reflect the differences in worldimports <strong>and</strong> exports. 3/ <strong>World</strong> imports <strong>and</strong> exports may not balance due to differences in marketing years, grain intransit, <strong>and</strong> reporting discrepancies in some countries. 4/ Argentina, Brazil, <strong>and</strong> South Africa. 5/ Egypt, the EuropeanUnion, Mexico, Japan, South Korea, Taiwan, <strong>and</strong> Southeast Asia. 6/ Trade excludes intra-trade. 7/ Indonesia, Malaysia,Philippines, Thail<strong>and</strong>, <strong>and</strong> Vietnam.