World Agricultural Supply and Demand Estimates
World Agricultural Supply and Demand Estimates
World Agricultural Supply and Demand Estimates

You also want an ePaper? Increase the reach of your titles
YUMPU automatically turns print PDFs into web optimized ePapers that Google loves.
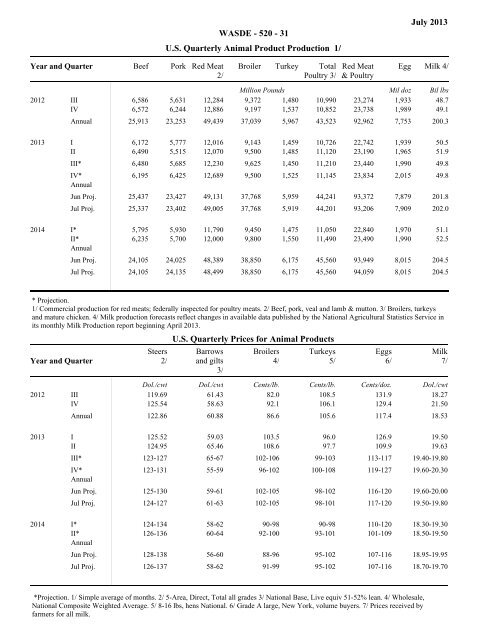
WASDE - 520 - 31U.S. Quarterly Animal Product Production 1/July 2013Year <strong>and</strong> Quarter Beef Pork Red Meat2/Broiler Turkey TotalPoultry 3/Red Meat& PoultryEgg Milk 4/Million Pounds Mil doz Bil lbs2012 III 6,586 5,631 12,284 9,372 1,480 10,990 23,274 1,933 48.7IV 6,572 6,244 12,886 9,197 1,537 10,852 23,738 1,989 49.1Annual 25,913 23,253 49,439 37,039 5,967 43,523 92,962 7,753 200.32013 I 6,172 5,777 12,016 9,143 1,459 10,726 22,742 1,939 50.5II 6,490 5,515 12,070 9,500 1,485 11,120 23,190 1,965 51.9III* 6,480 5,685 12,230 9,625 1,450 11,210 23,440 1,990 49.8IV* 6,195 6,425 12,689 9,500 1,525 11,145 23,834 2,015 49.8AnnualJun Proj. 25,437 23,427 49,131 37,768 5,959 44,241 93,372 7,879 201.8Jul Proj. 25,337 23,402 49,005 37,768 5,919 44,201 93,206 7,909 202.02014 I* 5,795 5,930 11,790 9,450 1,475 11,050 22,840 1,970 51.1II* 6,235 5,700 12,000 9,800 1,550 11,490 23,490 1,990 52.5AnnualJun Proj. 24,105 24,025 48,389 38,850 6,175 45,560 93,949 8,015 204.5Jul Proj. 24,105 24,135 48,499 38,850 6,175 45,560 94,059 8,015 204.5* Projection.1/ Commercial production for red meats; federally inspected for poultry meats. 2/ Beef, pork, veal <strong>and</strong> lamb & mutton. 3/ Broilers, turkeys<strong>and</strong> mature chicken. 4/ Milk production forecasts reflect changes in available data published by the National <strong>Agricultural</strong> Statistics Service inits monthly Milk Production report beginning April 2013.U.S. Quarterly Prices for Animal ProductsYear <strong>and</strong> QuarterSteers2/Barrows<strong>and</strong> gilts3/Broilers4/Turkeys5/Dol./cwt Dol./cwt Cents/lb. Cents/lb. Cents/doz. Dol./cwt2012 III 119.69 61.43 82.0 108.5 131.9 18.27IV 125.54 58.63 92.1 106.1 129.4 21.50Annual 122.86 60.88 86.6 105.6 117.4 18.53Eggs6/Milk7/2013 I 125.52 59.03 103.5 96.0 126.9 19.50II 124.95 65.46 108.6 97.7 109.9 19.63III* 123-127 65-67 102-106 99-103 113-117 19.40-19.80IV* 123-131 55-59 96-102 100-108 119-127 19.60-20.30AnnualJun Proj. 125-130 59-61 102-105 98-102 116-120 19.60-20.00Jul Proj. 124-127 61-63 102-105 98-101 117-120 19.50-19.802014 I* 124-134 58-62 90-98 90-98 110-120 18.30-19.30II* 126-136 60-64 92-100 93-101 101-109 18.50-19.50AnnualJun Proj. 128-138 56-60 88-96 95-102 107-116 18.95-19.95Jul Proj. 126-137 58-62 91-99 95-102 107-116 18.70-19.70*Projection. 1/ Simple average of months. 2/ 5-Area, Direct, Total all grades 3/ National Base, Live equiv 51-52% lean. 4/ Wholesale,National Composite Weighted Average. 5/ 8-16 lbs, hens National. 6/ Grade A large, New York, volume buyers. 7/ Prices received byfarmers for all milk.