JOURNAL OF PUBLIC AFFAIRS EDUCATION - Naspaa
JOURNAL OF PUBLIC AFFAIRS EDUCATION - Naspaa
JOURNAL OF PUBLIC AFFAIRS EDUCATION - Naspaa
Create successful ePaper yourself
Turn your PDF publications into a flip-book with our unique Google optimized e-Paper software.
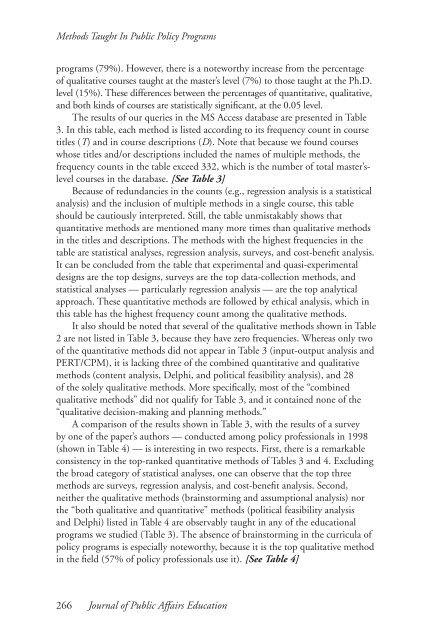
Methods Taught In Public Policy Programsprograms (79%). However, there is a noteworthy increase from the percentageof qualitative courses taught at the master’s level (7%) to those taught at the Ph.D.level (15%). These differences between the percentages of quantitative, qualitative,and both kinds of courses are statistically significant, at the 0.05 level.The results of our queries in the MS Access database are presented in Table3. In this table, each method is listed according to its frequency count in coursetitles (T) and in course descriptions (D). Note that because we found courseswhose titles and/or descriptions included the names of multiple methods, thefrequency counts in the table exceed 332, which is the number of total master’slevelcourses in the database. [See Table 3]Because of redundancies in the counts (e.g., regression analysis is a statisticalanalysis) and the inclusion of multiple methods in a single course, this tableshould be cautiously interpreted. Still, the table unmistakably shows thatquantitative methods are mentioned many more times than qualitative methodsin the titles and descriptions. The methods with the highest frequencies in thetable are statistical analyses, regression analysis, surveys, and cost-benefit analysis.It can be concluded from the table that experimental and quasi-experimentaldesigns are the top designs, surveys are the top data-collection methods, andstatistical analyses — particularly regression analysis — are the top analyticalapproach. These quantitative methods are followed by ethical analysis, which inthis table has the highest frequency count among the qualitative methods.It also should be noted that several of the qualitative methods shown in Table2 are not listed in Table 3, because they have zero frequencies. Whereas only twoof the quantitative methods did not appear in Table 3 (input-output analysis andPERT/CPM), it is lacking three of the combined quantitative and qualitativemethods (content analysis, Delphi, and political feasibility analysis), and 28of the solely qualitative methods. More specifically, most of the “combinedqualitative methods” did not qualify for Table 3, and it contained none of the“qualitative decision-making and planning methods.”A comparison of the results shown in Table 3, with the results of a surveyby one of the paper’s authors — conducted among policy professionals in 1998(shown in Table 4) — is interesting in two respects. First, there is a remarkableconsistency in the top-ranked quantitative methods of Tables 3 and 4. Excludingthe broad category of statistical analyses, one can observe that the top threemethods are surveys, regression analysis, and cost-benefit analysis. Second,neither the qualitative methods (brainstorming and assumptional analysis) northe “both qualitative and quantitative” methods (political feasibility analysisand Delphi) listed in Table 4 are observably taught in any of the educationalprograms we studied (Table 3). The absence of brainstorming in the curricula ofpolicy programs is especially noteworthy, because it is the top qualitative methodin the field (57% of policy professionals use it). [See Table 4]266 Journal of Public Affairs Education


