

Annual Report 2011 - Analist.be
Annual Report 2011 - Analist.be
Annual Report 2011 - Analist.be

You also want an ePaper? Increase the reach of your titles
YUMPU automatically turns print PDFs into web optimized ePapers that Google loves.
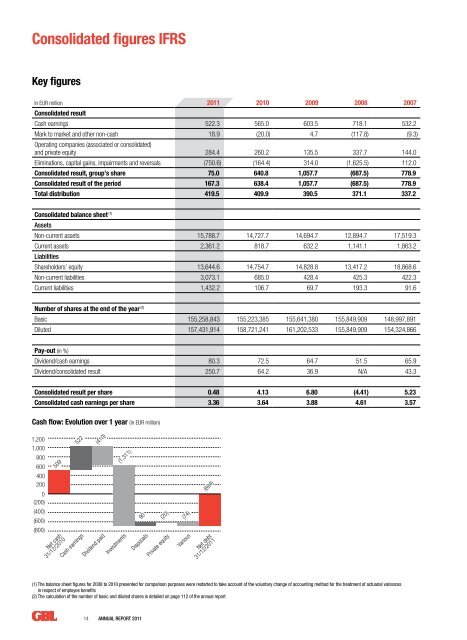
Consolidated figures IFRSKey figuresIn EUR million <strong>2011</strong> 2010 2009 2008 2007Consolidated resultCash earnings 522.3 565.0 603.5 718.1 532.2Mark to market and other non-cash 18.9 (20.0) 4.7 (117.8) (9.3)Operating companies (associated or consolidated)and private equity 284.4 260.2 135.5 337.7 144.0Eliminations, capital gains, impairments and reversals (750.6) (164.4) 314.0 (1,625.5) 112.0Consolidated result, group’s share 75.0 640.8 1,057.7 (687.5) 778.9Consolidated result of the period 167.3 638.4 1,057.7 (687.5) 778.9Total distribution 419.5 409.9 390.5 371.1 337.2Consolidated balance sheet (1)AssetsNon-current assets 15,788.7 14,727.7 14,694.7 12,894.7 17,519.3Current assets 2,361.2 818.7 632.2 1,141.1 1,863.2LiabilitiesShareholders’ equity 13,644.6 14,754.7 14,828.8 13,417.2 18,868.6Non-current liabilities 3,073.1 685.0 428.4 425.3 422.3Current liabilities25,0001,432.2 106.7 69.7 193.3 91.620,000 Num<strong>be</strong>r of shares at the end of the year (2)Basic 155,258,843 155,223,385 155,641,380 155,849,909 148,997,89115,000 Diluted 157,431,914 158,721,241 161,202,533 155,849,909 154,324,86610,000Pay-out (in %)Dividend/cash earnings5,00080.3 72.5 64.7 51.5 65.9Dividend/consolidated result 250.7 64.2 36.9 N/A 43.30Consolidated result per share 0.48 4.13 6.80 (4.41) 5.23Consolidated cash earnings per share 3.36 3.64 3.88 4.61 3.5720027,0417,52820038,8892004200511,11016,7632006200719,74612,8112008200915,23214,324201011,561 12,838<strong>2011</strong>02/2012Cash flow: Evolution over 1 year (in EUR million)1,2001,0008006004002000(200)(400)(600)(800)509Net cash31/12/2010522Cash earnings(410)Dividend paid(1,311)Investments90DisposalsPrivate equity(20)(74)Various(694)Net debt31/12/<strong>2011</strong>(1) The balance sheet figures for 2008 to 2010 presented for comparison purposes were restarted to take account of the voluntary change of accounting method for the treatment of actuarial variancesin respect of employee <strong>be</strong>nefits(2) The calculation of the num<strong>be</strong>r of basic and diluted shares is detailed on page 112 of the annual report2010Suez Environnement 3.8% 14 <strong>Annual</strong> <strong>Report</strong> <strong>2011</strong>Imerys 3.9%2.1% Other


