

Annual Report 2011 - Analist.be
Annual Report 2011 - Analist.be
Annual Report 2011 - Analist.be

You also want an ePaper? Increase the reach of your titles
YUMPU automatically turns print PDFs into web optimized ePapers that Google loves.
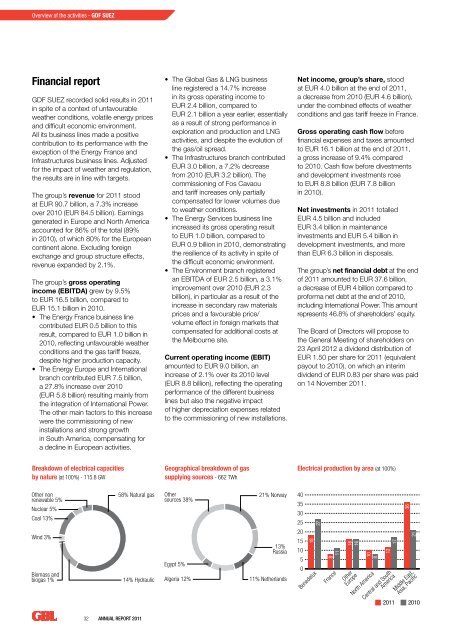
Overview of the activities - GDF SUEZFinancial reportGDF SUEZ recorded solid results in <strong>2011</strong>in spite of a context of unfavourableweather conditions, volatile energy pricesand difficult economic environment.All its business lines made a positivecontribution to its performance with theexception of the Energy France andInfrastructures business lines. Adjustedfor the impact of weather and regulation,the results are in line with targets.The group’s revenue for <strong>2011</strong> stoodat EUR 90.7 billion, a 7.3% increaseover 2010 (EUR 84.5 billion). Earningsgenerated in Europe and North Americaaccounted for 86% of the total (89%in 2010), of which 80% for the Europeancontinent alone. Excluding foreignexchange and group structure effects,revenue expanded by 2.1%.The group’s gross operatingincome (EBITDA) grew by 9.5%to EUR 16.5 billion, compared toEUR 15.1 billion in 2010.• The Energy France business linecontributed EUR 0.5 billion to thisresult, compared to EUR 1.0 billion in2010, reflecting unfavourable weatherconditions and the gas tariff freeze,despite higher production capacity.• The Energy Europe and Internationalbranch contributed EUR 7.5 billion,a 27.8% increase over 2010(EUR 5.8 billion) resulting mainly fromthe integration of International Power.The other main factors to this increasewere the commissioning of newinstallations and strong growthin South America, compensating fora decline in European activities.• The Global Gas & LNG businessline registered a 14.7% increasein its gross operating income toEUR 2.4 billion, compared toEUR 2.1 billion a year earlier, essentiallyas a result of strong performance inexploration and production and LNGactivities, and despite the evolution ofthe gas/oil spread.• The Infrastructures branch contributedEUR 3.0 billion, a 7.2% decreasefrom 2010 (EUR 3.2 billion). Thecommissioning of Fos Cavaouand tariff increases only partiallycompensated for lower volumes dueto weather conditions.• The Energy Services business lineincreased its gross operating resultto EUR 1.0 billion, compared toEUR 0.9 billion in 2010, demonstratingthe resilience of its activity in spite ofthe difficult economic environment.• The Environment branch registeredan EBITDA of EUR 2.5 billion, a 3.1%improvement over 2010 (EUR 2.3billion), in particular as a result of theincrease in secondary raw materialsprices and a favourable price/volume effect in foreign markets thatcompensated for additional costs atthe Melbourne site.Current operating income (EBIT)amounted to EUR 9.0 billion, anincrease of 2.1% over its 2010 level(EUR 8.8 billion), reflecting the operatingperformance of the different businesslines but also the negative impactof higher depreciation expenses relatedto the commissioning of new installations.Net income, group’s share, stoodat EUR 4.0 billion at the end of <strong>2011</strong>,a decrease from 2010 (EUR 4.6 billion),under the combined effects of weatherconditions and gas tariff freeze in France.Gross operating cash flow <strong>be</strong>forefinancial expenses and taxes amountedto EUR 16.1 billion at the end of <strong>2011</strong>,a gross increase of 9.4% comparedto 2010. Cash flow <strong>be</strong>fore divestmentsand development investments roseto EUR 8.8 billion (EUR 7.8 billionin 2010).Net investments in <strong>2011</strong> totalledEUR 4.5 billion and includedEUR 3.4 billion in maintenanceinvestments and EUR 5.4 billion indevelopment investments, and morethan EUR 6.3 billion in disposals.The group’s net financial debt at the endof <strong>2011</strong> amounted to EUR 37.6 billion,a decrease of EUR 4 billion compared toproforma net debt at the end of 2010,including International Power. This amountrepresents 46.8% of shareholders’ equity.The Board of Directors will propose tothe General Meeting of shareholders on23 April 2012 a dividend distribution ofEUR 1.50 per share for <strong>2011</strong> (equivalentpayout to 2010), on which an interimdividend of EUR 0.83 per share was paidon 14 Novem<strong>be</strong>r <strong>2011</strong>.Breakdown of electrical capacitiesby nature (at 100%) - 115.8 GWGeographical breakdown of gassupplying sources - 662 TWhElectrical production by area (at 100%)Other non Other non Other nonrenewable renewable 5% renewable 5% 5%Nuclear Nuclear 5% Nuclear 5% 5%Coal 13% Coal 13% Coal 13%Wind 3% Wind 3% Wind 3%Biomass Biomass and Biomass and andbiogas biogas 1% biogas 1% 1%58% Natural 58% Natural gas 58% Natural gas gas Other Other Othersources sources 38% sources 38% 38%Egypt 5% Egypt 5% Egypt 5%14% Hydraulic 14% Hydraulic 14% Hydraulic Algeria Algeria 12% Algeria 12% 12%21% Norway 21% Norway 21% Norway 40353025201513% 13% 13%Russia Russia Russia 10511% Netherlands 11% Netherlands 11% Netherlands01840353025272015105018403530252720151058011182781616118161610118161610128171012368172112361721BenedeluxBenedeluxFranceBenedeluxFrance OtherEuropeFrance OtherNorth America EuropeOtherCentral North and America Europe SouthAmericaCentral North and America SouthMiddle America East,Central Asia, and Pacific SouthMiddle America East,Asia, Pacific<strong>2011</strong> 20103621Middle East,Asia, Pacific32 <strong>Annual</strong> <strong>Report</strong> <strong>2011</strong>


