

Annual Report 2011 - Analist.be
Annual Report 2011 - Analist.be
Annual Report 2011 - Analist.be

Create successful ePaper yourself
Turn your PDF publications into a flip-book with our unique Google optimized e-Paper software.
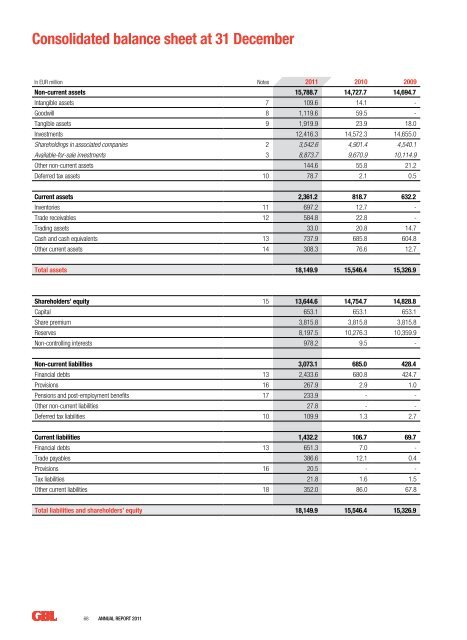
Consolidated balance sheet at 31 Decem<strong>be</strong>rIn EUR million Notes <strong>2011</strong> 2010 2009Non-current assets 15,788.7 14,727.7 14,694.7Intangible assets 7 109.6 14.1 -Goodwill 8 1,119.6 59.5 -Tangible assets 9 1,919.9 23.9 18.0Investments 12,416.3 14,572.3 14,655.0Shareholdings in associated companies 2 3,542.6 4,901.4 4,540.1Available-for-sale investments 3 8,873.7 9,670.9 10,114.9Other non-current assets 144.6 55.8 21.2Deferred tax assets 10 78.7 2.1 0.5Current assets 2,361.2 818.7 632.2Inventories 11 697.2 12.7 -Trade receivables 12 584.8 22.8 -Trading assets 33.0 20.8 14.7Cash and cash equivalents 13 737.9 685.8 604.8Other current assets 14 308.3 76.6 12.7Total assets 18,149.9 15,546.4 15,326.9Shareholders’ equity 15 13,644.6 14,754.7 14,828.8Capital 653.1 653.1 653.1Share premium 3,815.8 3,815.8 3,815.8Reserves 8,197.5 10,276.3 10,359.9Non-controlling interests 978.2 9.5 -Non-current liabilities 3,073.1 685.0 428.4Financial debts 13 2,433.6 680.8 424.7Provisions 16 267.9 2.9 1.0Pensions and post-employment <strong>be</strong>nefits 17 233.9 - -Other non-current liabilities 27.8 - -Deferred tax liabilities 10 109.9 1.3 2.7Current liabilities 1,432.2 106.7 69.7Financial debts 13 651.3 7.0 -Trade payables 386.6 12.1 0.4Provisions 16 20.5 - -Tax liabilities 21.8 1.6 1.5Other current liabilities 18 352.0 86.0 67.8Total liabilities and shareholders’ equity 18,149.9 15,546.4 15,326.968 <strong>Annual</strong> <strong>Report</strong> <strong>2011</strong>


