Download the PDF (5.4 MB) - Nedbank Group Limited
Download the PDF (5.4 MB) - Nedbank Group Limited
Download the PDF (5.4 MB) - Nedbank Group Limited

You also want an ePaper? Increase the reach of your titles
YUMPU automatically turns print PDFs into web optimized ePapers that Google loves.
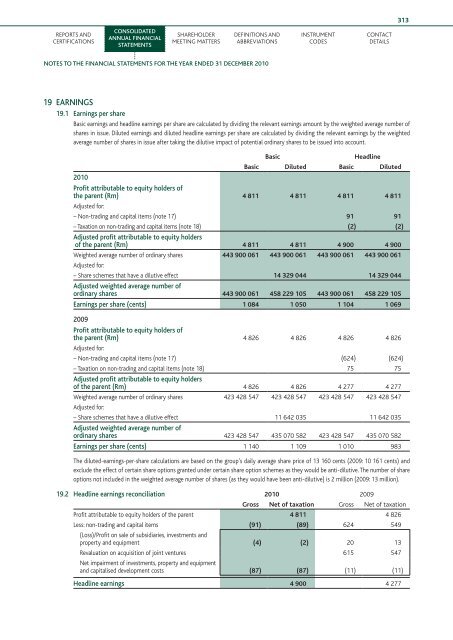
313Reports andcertificationsConsolidatedannual financialstatementsShareholdermeeting mattersDefinitions andabbreviationsInstrumentcodesContactdetailsnotes to <strong>the</strong> financial statements for <strong>the</strong> year ended 31 December 201019 EARNINGS19.1 Earnings per shareBasic earnings and headline earnings per share are calculated by dividing <strong>the</strong> relevant earnings amount by <strong>the</strong> weighted average number ofshares in issue. Diluted earnings and diluted headline earnings per share are calculated by dividing <strong>the</strong> relevant earnings by <strong>the</strong> weightedaverage number of shares in issue after taking <strong>the</strong> dilutive impact of potential ordinary shares to be issued into account.BasicHeadlineBasic Diluted Basic Diluted2010Profit attributable to equity holders of<strong>the</strong> parent (Rm) 4 811 4 811 4 811 4 811Adjusted for:– Non-trading and capital items (note 17) 91 91– Taxation on non-trading and capital items (note 18) (2) (2)Adjusted profit attributable to equity holdersof <strong>the</strong> parent (Rm) 4 811 4 811 4 900 4 900Weighted average number of ordinary shares 443 900 061 443 900 061 443 900 061 443 900 061Adjusted for:– Share schemes that have a dilutive effect 14 329 044 14 329 044Adjusted weighted average number ofordinary shares 443 900 061 458 229 105 443 900 061 458 229 105Earnings per share (cents) 1 084 1 050 1 104 1 0692009Profit attributable to equity holders of<strong>the</strong> parent (Rm) 4 826 4 826 4 826 4 826Adjusted for:– Non-trading and capital items (note 17) (624) (624)– Taxation on non-trading and capital items (note 18) 75 75Adjusted profit attributable to equity holdersof <strong>the</strong> parent (Rm) 4 826 4 826 4 277 4 277Weighted average number of ordinary shares 423 428 547 423 428 547 423 428 547 423 428 547Adjusted for:– Share schemes that have a dilutive effect 11 642 035 11 642 035Adjusted weighted average number ofordinary shares 423 428 547 435 070 582 423 428 547 435 070 582Earnings per share (cents) 1 140 1 109 1 010 983The diluted-earnings-per-share calculations are based on <strong>the</strong> group’s daily average share price of 13 160 cents (2009: 10 161 cents) andexclude <strong>the</strong> effect of certain share options granted under certain share option schemes as <strong>the</strong>y would be anti-dilutive. The number of shareoptions not included in <strong>the</strong> weighted average number of shares (as <strong>the</strong>y would have been anti-dilutive) is 2 million (2009: 13 million).19.2 Headline earnings reconciliation 2010 2009Gross Net of taxation Gross Net of taxationProfit attributable to equity holders of <strong>the</strong> parent 4 811 4 826Less: non-trading and capital items (91) (89) 624 549(Loss)/Profit on sale of subsidiaries, investments andproperty and equipment (4) (2) 20 13Revaluation on acquisition of joint ventures 615 547Net impairment of investments, property and equipmentand capitalised development costs (87) (87) (11) (11)Headline earnings 4 900 4 277