Download the PDF (5.4 MB) - Nedbank Group Limited
Download the PDF (5.4 MB) - Nedbank Group Limited
Download the PDF (5.4 MB) - Nedbank Group Limited

You also want an ePaper? Increase the reach of your titles
YUMPU automatically turns print PDFs into web optimized ePapers that Google loves.
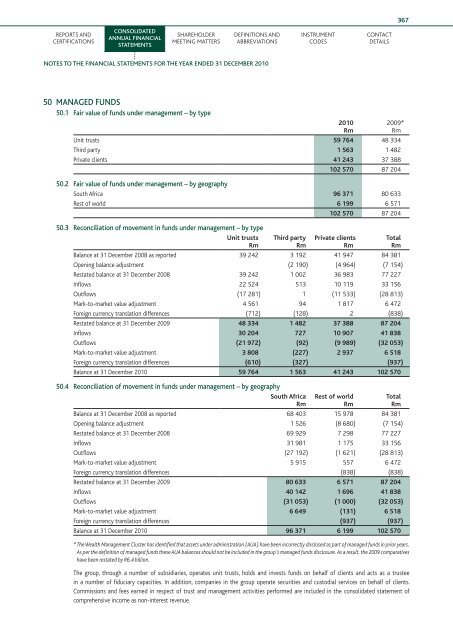
367Reports andcertificationsConsolidatedannual financialstatementsShareholdermeeting mattersDefinitions andabbreviationsInstrumentcodesContactdetailsnotes to <strong>the</strong> financial statements for <strong>the</strong> year ended 31 December 201050 MANAGED FUNDS50.1 Fair value of funds under management – by typeUnit trusts 59 764 48 334Third party 1 563 1 482Private clients 41 243 37 388102 570 87 20450.2 Fair value of funds under management – by geographySouth Africa 96 371 80 633Rest of world 6 199 6 571102 570 87 20450.3 Reconciliation of movement in funds under management – by typeUnit trustsRmThird partyRm2010RmPrivate clientsRm2009*RmBalance at 31 December 2008 as reported 39 242 3 192 41 947 84 381Opening balance adjustment (2 190) (4 964) (7 154)Restated balance at 31 December 2008 39 242 1 002 36 983 77 227Inflows 22 524 513 10 119 33 156Outflows (17 281) 1 (11 533) (28 813)Mark-to-market value adjustment 4 561 94 1 817 6 472Foreign currency translation differences (712) (128) 2 (838)Restated balance at 31 December 2009 48 334 1 482 37 388 87 204Inflows 30 204 727 10 907 41 838Outflows (21 972) (92) (9 989) (32 053)Mark-to-market value adjustment 3 808 (227) 2 937 6 518Foreign currency translation differences (610) (327) (937)Balance at 31 December 2010 59 764 1 563 41 243 102 57050.4 Reconciliation of movement in funds under management – by geographySouth AfricaRmRest of worldRmBalance at 31 December 2008 as reported 68 403 15 978 84 381Opening balance adjustment 1 526 (8 680) (7 154)Restated balance at 31 December 2008 69 929 7 298 77 227Inflows 31 981 1 175 33 156Outflows (27 192) (1 621) (28 813)Mark-to-market value adjustment 5 915 557 6 472Foreign currency translation differences (838) (838)Restated balance at 31 December 2009 80 633 6 571 87 204Inflows 40 142 1 696 41 838Outflows (31 053) (1 000) (32 053)Mark-to-market value adjustment 6 649 (131) 6 518Foreign currency translation differences (937) (937)Balance at 31 December 2010 96 371 6 199 102 570* The Wealth Management Cluster has identified that assets under administration (AUA) have been incorrectly disclosed as part of managed funds in prior years.As per <strong>the</strong> definition of managed funds <strong>the</strong>se AUA balances should not be included in <strong>the</strong> group’s managed funds disclosure. As a result, <strong>the</strong> 2009 comparativeshave been restated by R6,4 billion.The group, through a number of subsidiaries, operates unit trusts, holds and invests funds on behalf of clients and acts as a trusteein a number of fiduciary capacities. In addition, companies in <strong>the</strong> group operate securities and custodial services on behalf of clients.Commissions and fees earned in respect of trust and management activities performed are included in <strong>the</strong> consolidated statement ofcomprehensive income as non-interest revenue.TotalRmTotalRm