- Page 2:
Dear shareholders and other stakeho
- Page 5 and 6: 215Reports andcertificationsConsoli
- Page 7 and 8: 217Reports andcertificationsConsoli
- Page 9 and 10: 219Reports andcertificationsConsoli
- Page 11 and 12: 221Reports andcertificationsConsoli
- Page 13 and 14: 223Reports andcertificationsConsoli
- Page 15 and 16: 225Reports andcertificationsConsoli
- Page 17 and 18: 227Reports andcertificationsConsoli
- Page 19 and 20: 229Reports andcertificationsConsoli
- Page 21 and 22: 231Reports andcertificationsConsoli
- Page 23 and 24: 233Reports andcertificationsConsoli
- Page 25 and 26: 235Reports andcertificationsConsoli
- Page 27 and 28: 237Reports andcertificationsConsoli
- Page 29 and 30: 239Reports andcertificationsConsoli
- Page 31 and 32: 241Reports andcertificationsConsoli
- Page 33 and 34: 243Reports andcertificationsConsoli
- Page 35 and 36: 245Reports andcertificationsConsoli
- Page 37 and 38: 247Reports andcertificationsConsoli
- Page 39 and 40: 249Reports andcertificationsConsoli
- Page 41 and 42: 251Reports andcertificationsConsoli
- Page 43 and 44: 253Reports andcertificationsConsoli
- Page 45 and 46: 255Reports andcertificationsConsoli
- Page 47: 257Reports andcertificationsConsoli
- Page 52 and 53: 262 NEDBANK GROUP Limited INTEGRATE
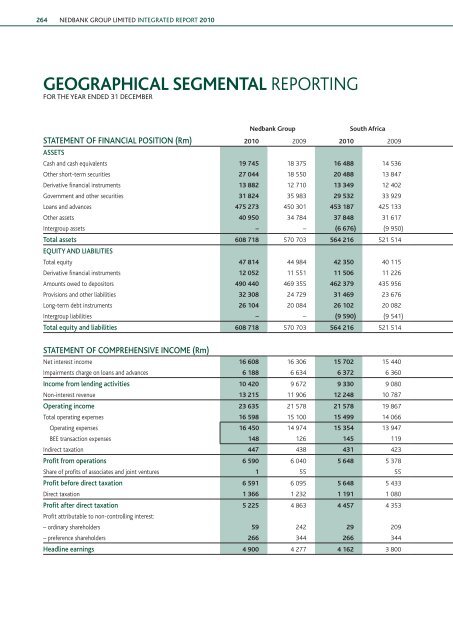
- Page 56 and 57: 266 NEDBANK GROUP Limited INTEGRATE
- Page 58 and 59: 268 NEDBANK GROUP Limited INTEGRATE
- Page 60 and 61: 270 NEDBANK GROUP Limited INTEGRATE
- Page 62 and 63: 272 NEDBANK GROUP Limited INTEGRATE
- Page 64 and 65: 274 NEDBANK GROUP Limited INTEGRATE
- Page 66 and 67: 276 NEDBANK GROUP Limited INTEGRATE
- Page 68 and 69: 278 NEDBANK GROUP Limited INTEGRATE
- Page 70 and 71: 280 NEDBANK GROUP Limited INTEGRATE
- Page 72 and 73: 282 NEDBANK GROUP Limited INTEGRATE
- Page 74 and 75: 284 NEDBANK GROUP Limited INTEGRATE
- Page 76 and 77: 286 NEDBANK GROUP Limited INTEGRATE
- Page 78 and 79: 288 NEDBANK GROUP Limited INTEGRATE
- Page 80 and 81: 290 NEDBANK GROUP Limited INTEGRATE
- Page 82 and 83: 292 NEDBANK GROUP Limited INTEGRATE
- Page 84 and 85: 294 NEDBANK GROUP Limited INTEGRATE
- Page 86 and 87: 296 NEDBANK GROUP Limited INTEGRATE
- Page 88 and 89: 298 NEDBANK GROUP Limited INTEGRATE
- Page 90 and 91: 300 NEDBANK GROUP Limited INTEGRATE
- Page 92 and 93: 302 NEDBANK GROUP Limited INTEGRATE
- Page 94 and 95: 304 NEDBANK GROUP Limited INTEGRATE
- Page 96 and 97: 306 NEDBANK GROUP Limited INTEGRATE
- Page 98 and 99: 308 NEDBANK GROUP Limited INTEGRATE
- Page 100 and 101: 310 NEDBANK GROUP Limited INTEGRATE
- Page 102 and 103: 312 NEDBANK GROUP Limited INTEGRATE
- Page 104 and 105:
314 NEDBANK GROUP Limited INTEGRATE
- Page 106 and 107:
316 NEDBANK GROUP Limited INTEGRATE
- Page 108 and 109:
318 NEDBANK GROUP Limited INTEGRATE
- Page 110 and 111:
320 NEDBANK GROUP Limited INTEGRATE
- Page 112 and 113:
322 NEDBANK GROUP Limited INTEGRATE
- Page 114 and 115:
324 NEDBANK GROUP Limited INTEGRATE
- Page 116 and 117:
326 NEDBANK GROUP Limited INTEGRATE
- Page 118 and 119:
328 NEDBANK GROUP Limited INTEGRATE
- Page 120 and 121:
330 NEDBANK GROUP Limited INTEGRATE
- Page 122 and 123:
332 NEDBANK GROUP Limited INTEGRATE
- Page 124 and 125:
334 NEDBANK GROUP Limited INTEGRATE
- Page 126 and 127:
336 NEDBANK GROUP Limited INTEGRATE
- Page 128 and 129:
338 NEDBANK GROUP Limited INTEGRATE
- Page 130 and 131:
340 NEDBANK GROUP Limited INTEGRATE
- Page 132 and 133:
342 NEDBANK GROUP Limited INTEGRATE
- Page 134 and 135:
344 NEDBANK GROUP Limited INTEGRATE
- Page 136 and 137:
346 NEDBANK GROUP Limited INTEGRATE
- Page 138 and 139:
348 NEDBANK GROUP Limited INTEGRATE
- Page 140 and 141:
350 NEDBANK GROUP Limited INTEGRATE
- Page 142 and 143:
352 NEDBANK GROUP Limited INTEGRATE
- Page 144 and 145:
354 NEDBANK GROUP Limited INTEGRATE
- Page 146 and 147:
356 NEDBANK GROUP Limited INTEGRATE
- Page 148 and 149:
358 NEDBANK GROUP Limited INTEGRATE
- Page 150 and 151:
360 NEDBANK GROUP Limited INTEGRATE
- Page 152 and 153:
362 NEDBANK GROUP Limited INTEGRATE
- Page 154 and 155:
364 NEDBANK GROUP Limited INTEGRATE
- Page 156 and 157:
366 NEDBANK GROUP Limited INTEGRATE
- Page 158 and 159:
368 NEDBANK GROUP Limited INTEGRATE
- Page 160 and 161:
370 NEDBANK GROUP Limited INTEGRATE
- Page 162 and 163:
372 NEDBANK GROUP Limited INTEGRATE
- Page 164 and 165:
374 NEDBANK GROUP Limited INTEGRATE
- Page 166 and 167:
376 NEDBANK GROUP Limited INTEGRATE
- Page 168 and 169:
378 NEDBANK GROUP Limited INTEGRATE
- Page 170 and 171:
380 NEDBANK GROUP Limited INTEGRATE
- Page 172 and 173:
382 NEDBANK GROUP Limited INTEGRATE
- Page 174 and 175:
384 NEDBANK GROUP Limited INTEGRATE
- Page 176 and 177:
386 NEDBANK GROUP Limited INTEGRATE
- Page 178 and 179:
388 NEDBANK GROUP Limited INTEGRATE
- Page 180 and 181:
390 NEDBANK GROUP Limited INTEGRATE
- Page 182 and 183:
392 NEDBANK GROUP Limited INTEGRATE
- Page 184 and 185:
394 NEDBANK GROUP Limited INTEGRATE
- Page 186 and 187:
396 NEDBANK GROUP Limited INTEGRATE
- Page 188 and 189:
398 NEDBANK GROUP Limited INTEGRATE
- Page 190 and 191:
400 NEDBANK GROUP Limited INTEGRATE
- Page 192 and 193:
402 NEDBANK GROUP Limited INTEGRATE
- Page 194 and 195:
404 NEDBANK GROUP Limited INTEGRATE
- Page 196:
406 NEDBANK GROUP Limited INTEGRATE


