Download the PDF (5.4 MB) - Nedbank Group Limited
Download the PDF (5.4 MB) - Nedbank Group Limited
Download the PDF (5.4 MB) - Nedbank Group Limited

Create successful ePaper yourself
Turn your PDF publications into a flip-book with our unique Google optimized e-Paper software.
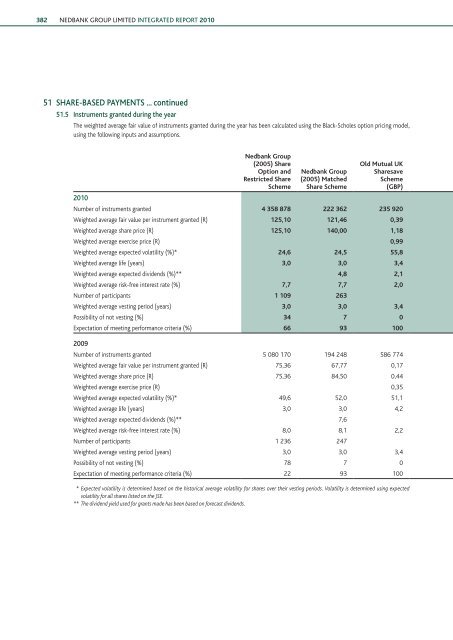
382 NEDBANK GROUP <strong>Limited</strong> INTEGRATED REPORT 201051 SHARE-BASED PAYMENTS ... continued51.5 Instruments granted during <strong>the</strong> yearThe weighted average fair value of instruments granted during <strong>the</strong> year has been calculated using <strong>the</strong> Black-Scholes option pricing model,using <strong>the</strong> following inputs and assumptions.2010<strong>Nedbank</strong> <strong>Group</strong>(2005) ShareOption andRestricted ShareScheme<strong>Nedbank</strong> <strong>Group</strong>(2005) MatchedShare SchemeOld Mutual UKSharesaveScheme(GBP)Number of instruments granted 4 358 878 222 362 235 920Weighted average fair value per instrument granted (R) 125,10 121,46 0,39Weighted average share price (R) 125,10 140,00 1,18Weighted average exercise price (R) 0,99Weighted average expected volatility (%)* 24,6 24,5 55,8Weighted average life (years) 3,0 3,0 3,4Weighted average expected dividends (%)** 4,8 2,1Weighted average risk-free interest rate (%) 7,7 7,7 2,0Number of participants 1 109 263Weighted average vesting period (years) 3,0 3,0 3,4Possibility of not vesting (%) 34 7 0Expectation of meeting performance criteria (%) 66 93 1002009Number of instruments granted 5 080 170 194 248 586 774Weighted average fair value per instrument granted (R) 75,36 67,77 0,17Weighted average share price (R) 75,36 84,50 0,44Weighted average exercise price (R) 0,35Weighted average expected volatility (%)* 49,6 52,0 51,1Weighted average life (years) 3,0 3,0 4,2Weighted average expected dividends (%)** 7,6Weighted average risk-free interest rate (%) 8,0 8,1 2,2Number of participants 1 236 247Weighted average vesting period (years) 3,0 3,0 3,4Possibility of not vesting (%) 78 7 0Expectation of meeting performance criteria (%) 22 93 100* Expected volatility is determined based on <strong>the</strong> historical average volatility for shares over <strong>the</strong>ir vesting periods. Volatility is determined using expectedvolatility for all shares listed on <strong>the</strong> JSE.** The dividend yield used for grants made has been based on forecast dividends.