Atlas Copco 2008 â tough ending to a record year Annual Report ...
Atlas Copco 2008 â tough ending to a record year Annual Report ...
Atlas Copco 2008 â tough ending to a record year Annual Report ...
Create successful ePaper yourself
Turn your PDF publications into a flip-book with our unique Google optimized e-Paper software.
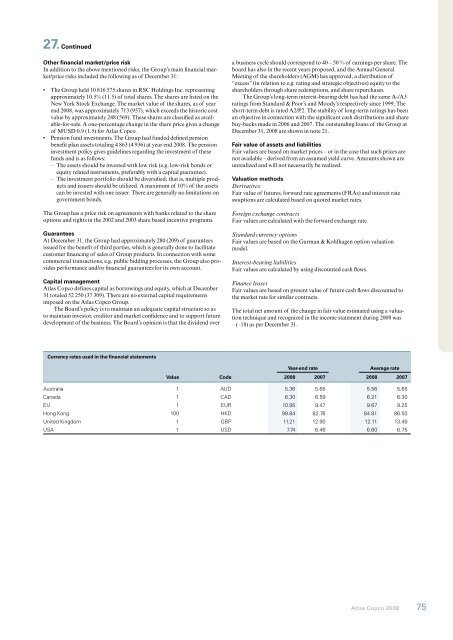
27. ContinuedOther financial market/price riskIn addition <strong>to</strong> the above mentioned risks, the Group’s main financial market/pricerisks included the following as of December 31:• The Group held 10 816 575 shares in RSC Holdings Inc. representingapproximately 10.5% (11.5) of <strong>to</strong>tal shares. The shares are listed on theNew York S<strong>to</strong>ck Exchange. The market value of the shares, as of <strong>year</strong>end <strong>2008</strong>, was approximately 713 (957), which exceeds the his<strong>to</strong>ric costvalue by approximately 248 (569). These shares are classified as available-for-sale.A one-percentage change in the share price gives a changeof MUSD 0.9 (1.5) for <strong>Atlas</strong> <strong>Copco</strong>.• Pension fund investments. The Group had funded defined pensionbenefit plan assets <strong>to</strong>taling 4 863 (4 936) at <strong>year</strong> end <strong>2008</strong>. The pensioninvestment policy gives guidelines regarding the investment of thesefunds and is as follows:– The assets should be invested with low risk (e.g. low-risk bonds orequity related instruments, preferably with a capital guarantee).– The investment portfolio should be diversified; that is, multiple productsand issuers should be utilized. A maximum of 10% of the assetscan be invested with one issuer. There are generally no limitations ongovernment bonds.The Group has a price risk on agreements with banks related <strong>to</strong> the shareoptions and rights in the 2002 and 2003 share based incentive programs.GuaranteesAt December 31, the Group had approximately 280 (209) of guaranteesissued for the benefit of third parties, which is generally done <strong>to</strong> facilitatecus<strong>to</strong>mer financing of sales of Group products. In connection with somecommercial transactions, e.g. public bidding processes, the Group also providesperformance and/or financial guarantees for its own account.Capital management<strong>Atlas</strong> <strong>Copco</strong> defines capital as borrowings and equity, which at December31 <strong>to</strong>taled 52 250 (37 309). There are no external capital requirementsimposed on the <strong>Atlas</strong> <strong>Copco</strong> Group.The Board’s policy is <strong>to</strong> maintain an adequate capital structure so as<strong>to</strong> maintain inves<strong>to</strong>r, credi<strong>to</strong>r and market confidence and <strong>to</strong> support futuredevelopment of the business. The Board’s opinion is that the dividend overa business cycle should correspond <strong>to</strong> 40 – 50 % of earnings per share. Theboard has also in the recent <strong>year</strong>s proposed, and the <strong>Annual</strong> GeneralMeeting of the shareholders (AGM) has approved, a distribution of“excess” (in relation <strong>to</strong> e.g. rating and strategic objectives) equity <strong>to</strong> theshareholders through share redemptions, and share repurchases.The Group’s long-term interest-bearing debt has had the same A-/A3ratings from Standard & Poor’s and Moody’s respectively since 1999. Theshort-term debt is rated A2/P2. The stability of long-term ratings has beenan objective in connection with the significant cash distributions and sharebuy-backs made in 2006 and 2007. The outstanding loans of the Group atDecember 31, <strong>2008</strong> are shown in note 21.Fair value of assets and liabilitiesFair values are based on market prices – or in the case that such prices arenot available – derived from an assumed yield curve. Amounts shown areunrealized and will not necessarily be realized.Valuation methodsDerivativesFair value of futures, forward rate agreements (FRAs) and interest rateswaptions are calculated based on quoted market rates.Foreign exchange contractsFair values are calculated with the forward exchange rate.Standard currency optionsFair values are based on the Garman & Kohlhagen option valuationmodel.Interest-bearing liabilitiesFair values are calculated by using discounted cash flows.Finance leasesFair values are based on present value of future cash flows discounted <strong>to</strong>the market rate for similar contracts.The <strong>to</strong>tal net amount of the change in fair value estimated using a valuationtechnique and recognized in the income statement during <strong>2008</strong> was– (–18) as per December 31.Currency rates used in the financial statementsYear-end rateAverage rateValue Code <strong>2008</strong> 2007 <strong>2008</strong> 2007Australia 1 AUD 5.36 5.65 5.56 5.65Canada 1 CAD 6.30 6.59 6.21 6.30EU 1 EUR 10.95 9.47 9.67 9.25Hong Kong 100 HKD 99.84 82.76 84.81 86.50United Kingdom 1 GBP 11.21 12.90 12.11 13.49USA 1 USD 7.74 6.46 6.60 6.75<strong>Atlas</strong> <strong>Copco</strong> <strong>2008</strong> 75


