Financial statements, atlas copco group28. Related partiesRelationshipsThe Group has related party relationships with the Company’s largestshareholder, its associates and with its Board members and GroupManagement. The Company’s largest shareholder, the Inves<strong>to</strong>r Group,controls approximately 22% of the voting rights in <strong>Atlas</strong> <strong>Copco</strong>.The subsidiaries that are directly owned by the Parent Company arepresented in note A22 <strong>to</strong> the financial statements of the Parent Company.Holding companies and operating subsidiaries are listed in note A23.Information about associated companies is found in note 14. Informationabout Board members and Group Management is presented on pages120–121 and pages 124–125.Transactions and outstanding balancesThe Group has not had any transactions with Inves<strong>to</strong>r during the <strong>year</strong> otherthan dividends declared and has no outstanding balances with Inves<strong>to</strong>r.The Inves<strong>to</strong>r Group has controlling or significant influence in companieswhich <strong>Atlas</strong> <strong>Copco</strong> may have transactions with in the normal courseof business. Any such transactions are made on commercial terms.Transactions with associated companiesThe Group sold various products and purchased goods through certainassociated companies on terms generally similar <strong>to</strong> those prevailing withunrelated parties. The following table summarizes the Group’s related partytransactions with its associates:<strong>2008</strong> 2007Revenues 23 47Goods purchased 103 193Service purchased 30 21At Dec. 31:Trade receivables 1 4Trade payables 14 14Guarantees 12 10Compensation <strong>to</strong> key management personnelCompensation <strong>to</strong> the Board and <strong>to</strong> Group Management is disclosed innote 5.29. Subsequent eventsIn January 2009, the <strong>Atlas</strong> <strong>Copco</strong> Board announced that Ronnie Leten,presently President of the Compressor Technique business area, will be thenew President and CEO of the <strong>Atlas</strong> <strong>Copco</strong> Group, effective June 1, 2009.He will replace Gunnar Brock who has decided <strong>to</strong> leave his position afterseven <strong>year</strong>s of leading the Group.In connection <strong>to</strong> the fourth quarter results on February 2, it wasannounced that additional reductions in the workforce will be made during2009 and is expected <strong>to</strong> affect more than 3 000 people globally. Costsrelated <strong>to</strong> these reductions are estimated <strong>to</strong> <strong>to</strong>tal 400.30. Accounting estimates and judgmentsThe preparation of financial reports requires management <strong>to</strong> make estimatesand assumptions that affect the amounts reported in the consolidatedfinancial statements and accompanying notes. Actual results coulddiffer from those estimates. Estimates and judgments which, in the opinionof management, are significant <strong>to</strong> the underlying amounts included in thefinancial statements and for which it would be reasonably possible thatfuture events or information could change those estimates or judgmentsinclude:Key sources of estimation uncertaintyImpairment of goodwill, other intangible assetsand other long-lived assetsIn accordance with IFRS, goodwill and certain trademarks are not amortizedbut are subject <strong>to</strong> annual tests for impairment. Other intangible assetsand other long-lived assets are amortized or depreciated based on management’sestimates of the period that the assets will generate revenue but arealso reviewed regularly for indications of impairment. These tests arebased on a review of the recoverable amount which is estimated basedon management’s projections of future cash flows which are made usingint ernal business plans and forecasts. Additional information on theestimates used in this review is included in note 12.Management judgment is required in the area of asset impairment,particularly in assessing– whether an event has occurred that may affect asset values,– whether the carrying value of an asset can be supported by the netpresent value of future cash flows, which are estimated based upon thecontinued use of the asset in the business, and– the appropriate assumptions <strong>to</strong> be applied in preparing cash flow projections.Changing the assumptions selected by management <strong>to</strong> determine thelevel, if any, of impairment could affect the financial condition and resultsof operation.Pension and post-employment benefit valuation assumptionsThe pension and post-employment obligations are dependent on theassumptions established by management and used by actuaries in calculatingsuch amounts. The assumptions include discount rates, inflation, salarygrowth, long-term return on plan assets, retirement rates, mortality rates,health care cost trend rates and other fac<strong>to</strong>rs. The actuarial assumptionsare reviewed on an annual basis and are changed when it is deemedappropriate. Actual results which differ from management’s assumptionsare accumulated and amortized over future periods and, therefore, affectthe recognized expense and <strong>record</strong>ed obligations in future periods. Seenote 23 for additional information regarding assumptions used in thecalculation of pension and post-retirement obligations.Credit loss reservesThe Group provides for credit losses based on specific provisions forknown cases and collective provisions for losses based on his<strong>to</strong>rical losslevels. Management’s judgment also considers rapidly changing marketconditions which may be particularly sensitive in cus<strong>to</strong>mer financing operations.Additional information is included in section Credit Risk in note 27.Inven<strong>to</strong>ry obsolescenceThe Group values inven<strong>to</strong>ry at the lower of his<strong>to</strong>rical cost, based on thefirst-in, first-out basis, and net realizable value. The calculation of netrealizable value involves management’s judgment as <strong>to</strong> over-s<strong>to</strong>ck articles,out-dated articles, damaged goods, handling and other selling costs. Seenote 16.Legal proceedingsIn accordance with IFRS, the Group recognizes a liability when <strong>Atlas</strong><strong>Copco</strong> has an obligation from a past event involving the transfer ofeconomic benefits and when a reasonable estimate can be made of whatthe transfer might be. The Group reviews outstanding legal cases regularlyin order <strong>to</strong> assess the need for provisions in the financial statements. Thesereviews consider the fac<strong>to</strong>rs of the specific case by internal legal counseland through the use of outside legal counsel and advisors when necessary.To the extent that management’s assessment of the fac<strong>to</strong>rs considered arenot reflected in subsequent developments, the financial statements could beaffected.Critical accounting judgmentsThere have been no critical accounting judgments in applying the Group’saccounting principles.78 <strong>Atlas</strong> <strong>Copco</strong> <strong>2008</strong>
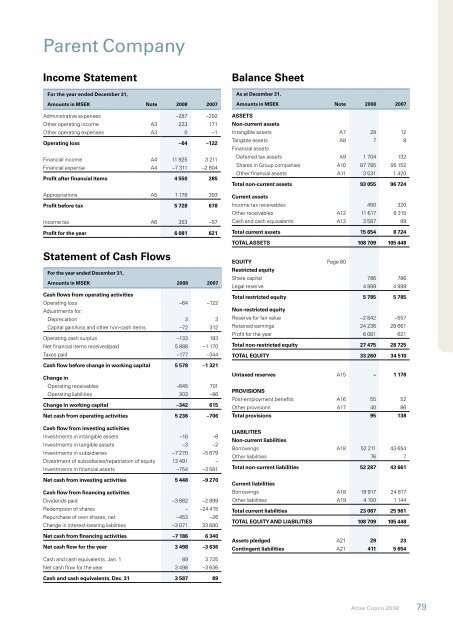
Parent CompanyIncome StatementFor the <strong>year</strong> ended December 31,Amounts in MSEK Note <strong>2008</strong> 2007Administrative expenses –287 –292Other operating income A3 223 171Other operating expenses A3 0 –1Operating loss –64 –122Financial income A4 11 925 3 211Financial expense A4 –7 311 –2 804Profit after financial items 4 550 285Appropriations A5 1 178 393Profit before tax 5 728 678Income tax A6 353 –57Profit for the <strong>year</strong> 6 081 621Statement of Cash FlowsFor the <strong>year</strong> ended December 31,Amounts in MSEK <strong>2008</strong> 2007Cash flows from operating activitiesOperating loss –64 –122Adjustments for:Depreciation 3 3Capital gain/loss and other non-cash items –72 312Operating cash surplus –133 193Net financial items received/paid 5 888 –1 170Taxes paid –177 –344Cash flow before change in working capital 5 578 –1 321Change inOperating receivables –645 701Operating liabilities 303 –86Change in working capital –342 615Net cash from operating activities 5 236 –706Cash flow from investing activitiesInvestments in intangible assets –16 –8Investments in tangible assets –3 –2Investments in subsidiaries –7 270 –5 679Divestment of subsidiaries/repatriation of equity 13 491 –Investments in financial assets –754 –3 581Net cash from investing activities 5 448 –9 270Cash flow from financing activitiesDividends paid –3 662 –2 899Redemption of shares – –24 415Repurchase of own shares, net –453 –26Change in interest-bearing liabilities –3 071 33 680Net cash from financing activities –7 186 6 340Net cash flow for the <strong>year</strong> 3 498 –3 636Balance SheetAs at December 31,Amounts in MSEK Note <strong>2008</strong> 2007ASSETSNon-current assetsIntangible assets A7 28 12Tangible assets A8 7 8Financial assetsDeferred tax assets A9 1 704 132Shares in Group companies A10 87 785 95 152Other financial assets A11 3 531 1 420Total non-current assets 93 055 96 724Current assetsIncome tax receivables 450 320Other receivables A12 11 617 8 315Cash and cash equivalents A13 3 587 89Total current assets 15 654 8 724TOTAL ASSETS 108 709 105 448EQUITY Page 80Restricted equityShare capital 786 786Legal reserve 4 999 4 999Total restricted equity 5 785 5 785Non-restricted equityReserve for fair value –2 842 –557Retained earnings 24 236 28 661Profit for the <strong>year</strong> 6 081 621Total non-restricted equity 27 475 28 725TOTAL EQUITY 33 260 34 510Untaxed reserves A15 – 1 178PROVISIONSPost-employment benefits A16 55 52Other provisions A17 40 86Total provisions 95 138LIABILITIESNon-current liabilitiesBorrowings A18 52 211 43 654Other liabilities 76 7Total non-current liabilities 52 287 43 661Current liabilitiesBorrowings A18 18 917 24 817Other liabilities A19 4 150 1 144Total current liabilities 23 067 25 961TOTAL EQUITY AND LIABILITIES 108 709 105 448Assets pledged A21 29 23Contingent liabilities A21 411 5 654Cash and cash equivalents, Jan. 1 89 3 725Net cash flow for the <strong>year</strong> 3 498 –3 636Cash and cash equivalents, Dec. 31 3 587 89<strong>Atlas</strong> <strong>Copco</strong> <strong>2008</strong> 79
- Page 1 and 2:
Atlas Copco2008 - tough ending to a
- Page 3 and 4:
• Strong order growth in most are
- Page 5 and 6:
Revenues by business areaRevenues b
- Page 7 and 8:
educing Atlas Copco’s main enviro
- Page 9 and 10:
Many new products were introduced d
- Page 11 and 12:
TargetsFinancial targetsAtlas Copco
- Page 13 and 14:
StructureThe Group is organized in
- Page 15 and 16:
New divisionEffective January 1, 20
- Page 17:
80 000Revenues and marginsMSEK %286
- Page 22 and 23:
administration reportconcentrated t
- Page 24 and 25:
administration reportEnvironmental
- Page 26 and 27:
ADMINISTRATION REPORTCompressor Tec
- Page 28 and 29:
administration reportThe Compressor
- Page 30 and 31: administration reportConstruction a
- Page 32 and 33: administration reportThe Constructi
- Page 34 and 35: administration reportIndustrial Tec
- Page 36 and 37: administration reportThe Industrial
- Page 38 and 39: Financial statements, atlas copco g
- Page 40 and 41: Financial statements, atlas copco g
- Page 42 and 43: Financial statements, atlas copco g
- Page 44 and 45: Financial statements, atlas copco g
- Page 46 and 47: Financial statements, atlas copco g
- Page 48 and 49: Financial statements, atlas copco g
- Page 50 and 51: Financial statements, atlas copco g
- Page 52 and 53: Financial statements, atlas copco g
- Page 54 and 55: Financial statements, atlas copco g
- Page 56 and 57: Financial statements, atlas copco g
- Page 58 and 59: Financial statements, atlas copco g
- Page 60 and 61: Financial statements, atlas copco g
- Page 62 and 63: Financial statements, atlas copco g
- Page 64 and 65: Financial statements, atlas copco g
- Page 66 and 67: Financial statements, atlas copco g
- Page 68 and 69: Financial statements, atlas copco g
- Page 70 and 71: Financial statements, atlas copco g
- Page 72 and 73: Financial statements, atlas copco g
- Page 74 and 75: Financial statements, atlas copco g
- Page 76 and 77: Financial statements, atlas copco g
- Page 78 and 79: Financial statements, atlas copco g
- Page 82 and 83: Financial statements, parent compan
- Page 84 and 85: Financial statements, parent compan
- Page 86 and 87: Financial statements, parent compan
- Page 88 and 89: Financial statements, parent compan
- Page 90 and 91: Financial statements, parent compan
- Page 92 and 93: Financial statements, parent compan
- Page 94 and 95: Financial statements, parent compan
- Page 96 and 97: Financial statements, parent compan
- Page 98 and 99: Audit ReportTo the Annual Meeting o
- Page 100 and 101: Sustainability ReportAtlas Copco’
- Page 102 and 103: SUSTAINABILITY REPORTRoles and resp
- Page 104 and 105: SUSTAINABILITY REPORTSociety and th
- Page 106 and 107: SUSTAINABILITY REPORT10080604020050
- Page 108 and 109: SUSTAINABILITY REPORTIn 2008, CO 2
- Page 110 and 111: SUSTAINABILITY REPORTwinter and coo
- Page 112 and 113: SUSTAINABILITY REPORTNo. of acciden
- Page 114 and 115: SUSTAINABILITY REPORTBusiness Partn
- Page 116 and 117: SUSTAINABILITY REPORTShareholdersTh
- Page 118 and 119: SUSTAINABILITY REPORTSustainability
- Page 120 and 121: Corporate Governance ReportThe Boar
- Page 122 and 123: Corporate Governance ReportBoard of
- Page 124 and 125: Corporate Governance ReportGroup St
- Page 126 and 127: Corporate Governance ReportGroup Ma
- Page 128 and 129: Corporate Governance ReportRemunera
- Page 130 and 131:
Corporate Governance ReportBusiness
- Page 132 and 133:
The Atlas Copco ShareAt December 31
- Page 134 and 135:
the atlas copco shareOwnership stru
- Page 136 and 137:
Five Years in SummaryMSEK 2004 1) 2
- Page 138 and 139:
Financial InformationWelcome to the
- Page 140:
We are committed to yoursuperior pr