Annual report 2012 - Comrod
Annual report 2012 - Comrod
Annual report 2012 - Comrod

Create successful ePaper yourself
Turn your PDF publications into a flip-book with our unique Google optimized e-Paper software.
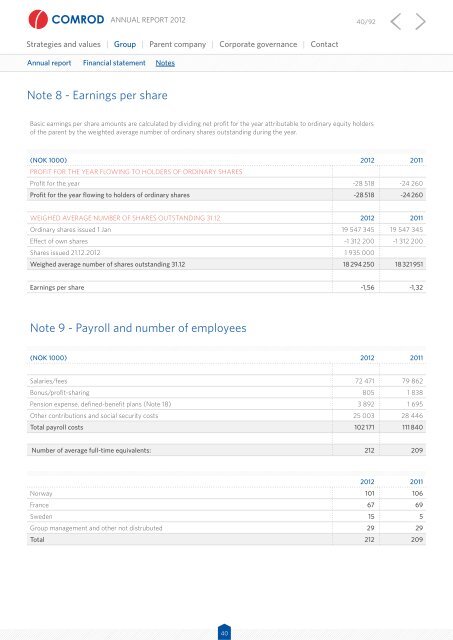
<strong>Annual</strong> <strong>report</strong> <strong>2012</strong> 40/92Strategies and values | Group | Parent company | Corporate governance | Contact<strong>Annual</strong> <strong>report</strong> Financial statement NotesNote 8 - Earnings per shareBasic earnings per share amounts are calculated by dividing net profit for the year attributable to ordinary equity holdersof the parent by the weighted average number of ordinary shares outstanding during the year.(NOK 1000) <strong>2012</strong> 2011Profit for the year flowing to holders of ordinary sharesProfit for the year -28 518 -24 260Profit for the year flowing to holders of ordinary shares -28 518 -24 260Weighed average number of shares outstanding 31.12 <strong>2012</strong> 2011Ordinary shares issued 1 Jan 19 547 345 19 547 345Effect of own shares -1 312 200 -1 312 200Shares issued 21.12.<strong>2012</strong> 1 935 000Weighed average number of shares outstanding 31.12 18 294 250 18 321 951Earnings per share -1,56 -1,32Note 9 - Payroll and number of employees(NOK 1000) <strong>2012</strong> 2011Salaries/fees 72 471 79 862Bonus/profit-sharing 805 1 838Pension expense, defined-benefit plans (Note 18) 3 892 1 695Other contributions and social security costs 25 003 28 446Total payroll costs 102 171 111 840Number of average full-time equivalents: 212 209<strong>2012</strong> 2011Norway 101 106France 67 69Sweden 15 5Group management and other not distrubuted 29 29Total 212 20940