Second Environmental Performance Review of Albania
Second Environmental Performance Review of Albania
Second Environmental Performance Review of Albania
Create successful ePaper yourself
Turn your PDF publications into a flip-book with our unique Google optimized e-Paper software.
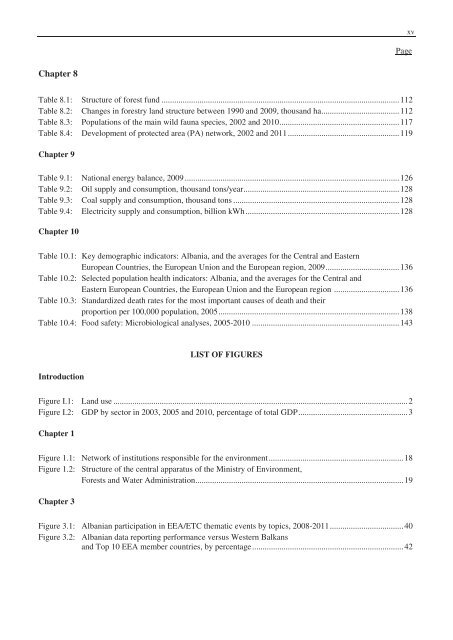
xvPageChapter 8Table 8.1:Table 8.2:Table 8.3:Table 8.4:Structure <strong>of</strong> forest fund ................................................................................................................. 112 Changes in forestry land structure between 1990 and 2009, thousand ha.....................................112 Populations <strong>of</strong> the main wild fauna species, 2002 and 2010 ......................................................... 117 Development <strong>of</strong> protected area (PA) network, 2002 and 2011.....................................................119Chapter 9Table 9.1:Table 9.2:Table 9.3:Table 9.4:National energy balance, 2009 ...................................................................................................... 126 Oil supply and consumption, thousand tons/year.......................................................................... 128 Coal supply and consumption, thousand tons ............................................................................... 128 Electricity supply and consumption, billion kWh......................................................................... 128 Chapter 10Table 10.1: Key demographic indicators: <strong>Albania</strong>, and the averages for the Central and EasternEuropean Countries, the European Union and the European region, 2009...................................136 Table 10.2: Selected population health indicators: <strong>Albania</strong>, and the averages for the Central and Eastern European Countries, the European Union and the European region ...............................136 Table 10.3: Standardized death rates for the most important causes <strong>of</strong> death and theirproportion per 100,000 population, 2005...................................................................................... 138 Table 10.4: Food safety: Microbiological analyses, 2005-2010 ...................................................................... 143 IntroductionLIST OF FIGURESFigure I.1: Land use ............................................................................................................................................ 2 Figure I.2: GDP by sector in 2003, 2005 and 2010, percentage <strong>of</strong> total GDP....................................................3 Chapter 1Figure 1.1: Network <strong>of</strong> institutions responsible for the environment................................................................ 18 Figure 1.2: Structure <strong>of</strong> the central apparatus <strong>of</strong> the Ministry <strong>of</strong> Environment,Forests and Water Administration................................................................................................... 19 Chapter 3Figure 3.1: <strong>Albania</strong>n participation in EEA/ETC thematic events by topics, 2008-2011 ...................................40 Figure 3.2: <strong>Albania</strong>n data reporting performance versus Western Balkansand Top 10 EEA member countries, by percentage........................................................................42


