- Page 1 and 2:
UNITED NATIONS ECONOMIC COMMISSION
- Page 6 and 7:
vPrefaceThe second EPR of Albania b
- Page 8 and 9:
viiLIST OF TEAM MEMBERSMr. Antoine
- Page 10 and 11:
ixMinistry of Agriculture, Food and
- Page 12 and 13:
xiCONTENTSForeword ................
- Page 14 and 15:
8.3 Biological diversity ..........
- Page 16 and 17:
xvPageChapter 8Table 8.1:Table 8.2:
- Page 18 and 19:
xviiPageLIST OF PHOTOSIntroductionP
- Page 20 and 21:
xixLIST OF ABBREVIATIONSAICASCICANP
- Page 22 and 23:
xxiSIGNS AND MEASURES .. not availa
- Page 24 and 25:
xxiiiExecutive summaryThe first Env
- Page 26 and 27:
The entire education system is subj
- Page 28 and 29:
was done by international consultan
- Page 30 and 31:
1Introduction I.1 Physical contextA
- Page 32 and 33:
Introduction3The country has deposi
- Page 34 and 35:
Introduction5Photo I.1: Ruins of Sk
- Page 36:
PART I: POLICYMAKING, PLANNING AND
- Page 39 and 40:
10 Part I: Policymaking, planning a
- Page 41 and 42:
12 Part I: Policymaking, planning a
- Page 43 and 44:
14 Part I: Policymaking, planning a
- Page 45 and 46:
16 Part I: Policymaking, planning a
- Page 47 and 48:
18 Part I: Policymaking, planning a
- Page 49 and 50:
20 Part I: Policymaking, planning a
- Page 51 and 52:
22 Part I: Policymaking, planning a
- Page 53 and 54:
24 Part I: Policymaking, planning a
- Page 55 and 56:
26 Part I: Policymaking, planning a
- Page 57 and 58:
28 Part I: Policymaking, planning a
- Page 59 and 60:
30 Part I: Policymaking, planning a
- Page 61 and 62:
32 Part I: Policymaking, planning a
- Page 63 and 64:
34 Part I: Policymaking, planning a
- Page 65 and 66:
36 Part I: Policymaking, planning a
- Page 67 and 68:
38 Part I: Policymaking, planning a
- Page 69 and 70:
40 Part I: Policymaking, planning a
- Page 71 and 72:
42 Part I: Policymaking, planning a
- Page 73 and 74:
44 Part I: Policymaking, planning a
- Page 75 and 76:
46 Part I: Policymaking, planning a
- Page 77 and 78:
48 Part I: Policymaking, planning a
- Page 79 and 80:
50 Part I: Policymaking, planning a
- Page 81 and 82:
52 Part I: Policymaking, planning a
- Page 83 and 84:
54 Part I: Policymaking, planning a
- Page 85 and 86:
56 Part I: Policymaking, planning a
- Page 87 and 88:
58 Part I: Policymaking, planning a
- Page 89 and 90:
60 Part I: Policymaking, planning a
- Page 91 and 92:
62 Part I: Policymaking, planning a
- Page 93 and 94:
64 Part I: Policymaking, planning a
- Page 96 and 97:
67Chapter 5ECONOMIC INSTRUMENTS AND
- Page 98 and 99:
Chapter 5: Economic instruments and
- Page 100 and 101:
Chapter 5: Economic instruments and
- Page 102 and 103:
Chapter 5: Economic instruments and
- Page 104 and 105:
Chapter 5: Economic instruments and
- Page 106 and 107:
Chapter 5: Economic instruments and
- Page 108:
PART III: INTEGRATION OF ENVIRONMEN
- Page 111 and 112:
82 Part III: Integration of environ
- Page 113 and 114:
84 Part III: Integration of environ
- Page 115 and 116:
86 Part III: Integration of environ
- Page 117 and 118:
88 Part III: Integration of environ
- Page 119 and 120:
90 Part III: Integration of environ
- Page 121 and 122:
92 Part III: Integration of environ
- Page 124 and 125:
95Chapter 7WASTE MANAGEMENT7.1 Intr
- Page 126 and 127:
Chapter 7: Waste management97sold f
- Page 128 and 129:
Chapter 7: Waste management99SitesC
- Page 130 and 131:
Chapter 7: Waste management101Table
- Page 132 and 133:
Chapter 7: Waste management103• C
- Page 134 and 135:
Chapter 7: Waste management105sever
- Page 136:
Chapter 7: Waste management107(b) E
- Page 139 and 140:
110 Part III: Integration of enviro
- Page 141 and 142:
112 Part III: Integration of enviro
- Page 143 and 144:
114 Part III: Integration of enviro
- Page 145 and 146:
116 Part III: Integration of enviro
- Page 147 and 148:
118 Part III: Integration of enviro
- Page 149 and 150:
120 Part III: Integration of enviro
- Page 151 and 152:
122 Part III: Integration of enviro
- Page 153 and 154:
124 Part III: Integration of enviro
- Page 155 and 156:
126 Part III: Integration of enviro
- Page 157 and 158:
128 Part III: Integration of enviro
- Page 159 and 160: 130 Part III: Integration of enviro
- Page 161 and 162: 132 Part III: Integration of enviro
- Page 164 and 165: 135Chapter 10HUMAN HEALTH AND ENVIR
- Page 166 and 167: Chapter 10: Human health and enviro
- Page 168 and 169: Chapter 10: Human health and enviro
- Page 170 and 171: Chapter 10: Human health and enviro
- Page 172 and 173: Chapter 10: Human health and enviro
- Page 174 and 175: Chapter 10: Human health and enviro
- Page 176 and 177: Chapter 10: Human health and enviro
- Page 178: Chapter 10: Human health and enviro
- Page 182 and 183: 153Annex IIMPLEMENTATION OF THE REC
- Page 184 and 185: The new 2011 Law on Environmental P
- Page 186 and 187: Recommendation 3.2:Albania needs to
- Page 188 and 189: Recommendation 4.2:The Ministry of
- Page 190 and 191: for 2004 was prepared within the St
- Page 192 and 193: 163Chapter 6: WATER MANAGEMENTRecom
- Page 194 and 195: There is no updated water resources
- Page 196 and 197: international consulting and author
- Page 198 and 199: it is limited only to the level of
- Page 200 and 201: taken. In addition, NES2, under MoE
- Page 202 and 203: 173Chapter 12: HUMAN HEALTH AND THE
- Page 204: Recommendation 12.5:(a) The Ministr
- Page 207 and 208: 178Worldwide agreementsYear1979 (BO
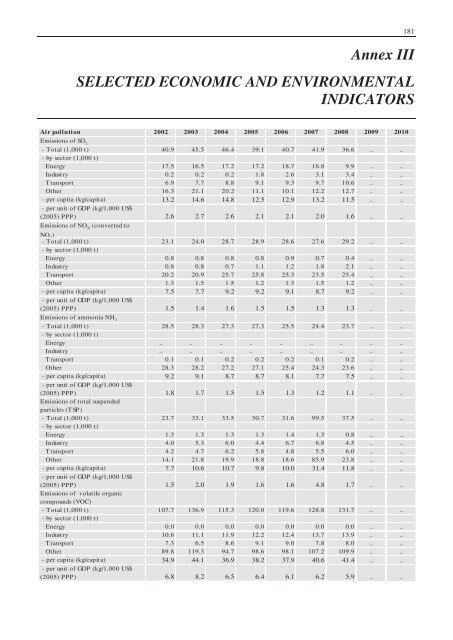
- Page 212 and 213: 183Land resources and soil 2002 200
- Page 214: Education 2002 2003 2004 2005 2006
- Page 217 and 218: 188Law on Local Tax System, No. 963
- Page 220 and 221: 191SourcesIndividual authors1. Bego
- Page 222 and 223: 19336. Albania, Ministry of Environ
- Page 224 and 225: 19568. National Agency of Natural R
- Page 226 and 227: 197101. International POPs Eliminat
- Page 228 and 229: 199UNDP and Ministry of Environment
- Page 230: 201172. National Agency for Environ