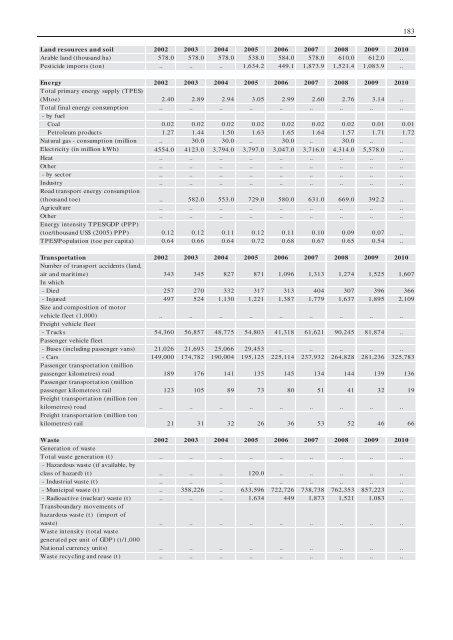
183Land resources and soil 2002 2003 2004 2005 2006 2007 2008 2009 2010Arable land (thousand ha) 578.0 578.0 578.0 538.0 584.0 578.0 610.0 612.0 ..Pesticide imports (ton) .. .. .. 1,634.2 449.1 1,873.9 1,521.4 1,083.9 ..Energy 2002 2003 2004 2005 2006 2007 2008 2009 2010Total primary energy supply (TPES)(Mtoe) 2.40 2.89 2.94 3.05 2.99 2.60 2.76 3.14 ..Total final energy consumption .. .. .. .. .. .. .. .. ..- by fuelCoal 0.02 0.02 0.02 0.02 0.02 0.02 0.02 0.01 0.01Petroleum products 1.27 1.44 1.50 1.63 1.65 1.64 1.57 1.71 1.72Natural gas - consumption (million .. 30.0 30.0 .. 30.0 .. 30.0 .. ..Electricity (in million kWh) 4554.0 4123.0 3,794.0 3,797.0 3,047.0 3,716.0 4,314.0 5,578.0 ..Heat .. .. .. .. .. .. .. .. ..Other .. .. .. .. .. .. .. .. ..- by sector .. .. .. .. .. .. .. .. ..Industry .. .. .. .. .. .. .. .. ..Road transport energy consumption(thousand toe) .. 582.0 553.0 729.0 580.0 631.0 669.0 392.2 ..Agriculture .. .. .. .. .. .. .. .. ..Other .. .. .. .. .. .. .. .. ..Energy intensity TPES/GDP (PPP)(toe/thousand US$ (2005) PPP) 0.12 0.12 0.11 0.12 0.11 0.10 0.09 0.07 ..TPES/Population (toe per capita) 0.64 0.66 0.64 0.72 0.68 0.67 0.65 0.54 ..Transportation 2002 2003 2004 2005 2006 2007 2008 2009 2010Number <strong>of</strong> transport accidents (land,air and maritime) 343 345 827 871 1,096 1,313 1,274 1,525 1,607In which- Died 257 270 332 317 313 404 307 396 366- Injured 497 524 1,130 1,221 1,387 1,779 1,637 1,895 2,109Size and composition <strong>of</strong> motorvehicle fleet (1,000) .. .. .. .. .. .. .. .. ..Freight vehicle fleet- Trucks 54,360 56,857 48,775 54,803 41,318 61,621 90,245 81,874 ..Passenger vehicle fleet- Buses (including passenger vans) 21,026 21,693 25,066 29,453 .. .. .. .. ..- Cars 149,000 174,782 190,004 195,125 225,114 237,932 264,828 281,236 325,783Passenger transportation (millionpassenger kilometres) road 189 176 141 135 145 134 144 139 136Passenger transportation (millionpassenger kilometres) rail 123 105 89 73 80 51 41 32 19Freight transportation (million tonkilometres) road .. .. .. .. .. .. .. .. ..Freight transportation (million tonkilometres) rail 21 31 32 26 36 53 52 46 66Waste 2002 2003 2004 2005 2006 2007 2008 2009 2010Generation <strong>of</strong> wasteTotal waste generation (t) .. .. .. .. .. .. .. .. ..- Hazardous waste (if available, byclass <strong>of</strong> hazard) (t) .. .. .. 120.0 .. .. .. .. ..- Industrial waste (t) .. .. .. .. .. .. .. .. ..- Municipal waste (t) .. 358,226 .. 633,596 722,726 738,738 762,353 857,223 ..- Radioactive (nuclear) waste (t) .. .. .. 1,634 449 1,873 1,521 1,083 ..Transboundary movements <strong>of</strong>hazardous waste (t) (import <strong>of</strong>waste) .. .. .. .. .. .. .. .. ..Waste intensity (total wastegenerated per unit <strong>of</strong> GDP) (t/1,000National currency units) .. .. .. .. .. .. .. .. ..Waste recycling and reuse (t) .. .. .. .. .. .. .. .. ..
184Demography and Health 2002 2003 2004 2005 2006 2007 2008 2009 2010Total population (million 3.09 3.11 3.13 3.14 3.16 3.17 3.18 3.19 3.20- % change (annual) 0.4 0.5 0.6 0.5 0.5 0.4 0.4 0.4 0.4- Population density 112.8 113.4 114.0 114.7 115.2 115.7 116.1 116.5 117.0Birth rate (per 1,000) 1) .. 14.7 14.1 13.6 13.3 13.0 12.9 12.8 12.8Total fertility rate 1) .. 1.9 1.8 1.8 1.7 1.6 1.6 1.6 1.5Mortality rate (per 1,000) 1) .. 5.8 5.8 5.8 5.9 5.9 6.0 6.1 6.1Infant mortality rate (deaths/1000live births) 1) .. 22.4 21.4 20.3 19.6 18.7 17.8 17.2 16.4Female life expectancy at birth .. 78.8 79.1 79.4 79.6 79.7 79.8 80.0 80.1Male life expectancy at birth (years) .. 72.5 72.8 73.0 73.2 73.4 73.6 73.7 73.9Life expectancy at birth (years) 1) .. 75.5 75.9 76.1 76.3 76.5 76.6 76.8 76.9Population ages 0-14 years (% <strong>of</strong> .. 27.8 27.0 26.3 25.5 24.8 24.1 23.4 22.7Population ages 15-64 years (% <strong>of</strong> 64.2 64.8 65.3 65.8 66.3 66.8 67.2 67.7Population 65 or above (% <strong>of</strong> total) .. 8.0 8.2 8.4 8.7 8.9 9.2 9.4 9.7Population with access to safedrinking water, total (%) 97.0 97.0 96.0 96.0 96.0 95.0 96.0 95.0 95.0- Urban (%) 99.0 99.0 98.0 98.0 98.0 97.0 97.0 96.0 96.0- Rural (%) 95.0 95.0 95.0 95.0 94.0 94.0 94.0 94.0 94.0Population with access to improvedsanitation, total (%) 86.0 87.0 88.0 90.0 91.0 91.0 93.0 94.0 94.0- Urban (%) 95.0 95.0 95.0 95.0 95.0 95.0 95.0 95.0 95.0- Rural (%) 80.0 81.0 83.0 85.0 87.0 88.0 90.0 92.0 93.0Active tuberculosis incidence rate(per 100,000 population) 22.0 20.0 20.0 19.0 17.0 16.0 16.0 15.0 14.0Viral hepatitis incidence rate,including vaccination cases (per .. .. .. .. .. .. .. .. ..Health expenditure (% <strong>of</strong> GDP) 1) 6.3 6.2 6.9 6.8 6.7 6.9 6.7 6.9 6.5Macroeconomic context 2002 2003 2004 2005 2006 2007 2008 2009 2010GDP- change over previous year (%change over previous year; in 2005prices and PPPs) 4.2 5.8 5.7 5.8 5.4 5.9 7.5 3.3 3.9- in current prices and PPPs, 13,067 14,119 15,349 18,671 21,151 22,725 26,124 27,614 29,164- in prices and PPPs <strong>of</strong> 2005 15,784 16,695 17,649 18,671 19,685 20,847 22,419 23,162 24,074Registered unemployment (% <strong>of</strong>labour force, end <strong>of</strong> period) 15.8 15.0 14.4 14.1 13.8 13.2 12.5 13.6 13.5Net foreign direct investment (FDI)(million US$) 135.0 178.0 341.0 262.0 325.0 662.0 959.0 964.0 1,110.0Net foreign direct investment (FDI)(as % <strong>of</strong> GDP) 3.0 3.1 4.5 3.2 3.5 6.1 6.8 7.7 9.1Cumulative FDI (million US$) 910.0 1,088.0 1,429.0 1,691.0 2,016.0 2,678.0 3,637.0 4,601.0 5,711.0Income distribution and poverty 2002 2003 2004 2005 2006 2007 2008 2009 2010GDP per capita at current prices andPPPs (US$) 4,229.0 4,545.0 4,912.0 5,943.0 6,700.0 7,170.0 8,212.0 8,649.0 9,102.0Consumer price index (CPI)(% change over the preceding year,annual average) 5.5 2.6 2.3 2.4 2.4 2.9 3.4 2.3 3.6Population below national poverty- Total (%) 25.4 .. .. 18.5 .. .. 12.4 .. ..- Urban (%) 19.5 .. .. 11.2 .. .. 10.1 .. ..- Rural (%) 29.6 .. .. 24.2 .. .. 14.6 .. ..PovertyIncome inequality (Gini coefficient) 28.15 .. 31.09 33.03 .. .. 34.51 .. ..Minimum to median wages(minimum wage as a percentage <strong>of</strong>median wage) .. .. .. .. .. .. .. .. ..Telecommunications 2002 2003 2004 2005 2006 2007 2008 2009 2010Telephone lines per 100 population 7.12 8.21 8.79 8.88 8.11 9.46 10.80 11.37 10.35Cellular subscribers per 100 27.54 35.41 40.31 48.71 60.50 73.27 98.74 130.35 141.93Personal computer in use per 100 1.17 1.36 1.55 1.74 3.84 4.15 4.61 .. ..Internet users per 100 population 0.39 0.97 2.42 6.04 9.61 15.04 23.86 41.20 45.00
- Page 1 and 2:
UNITED NATIONS ECONOMIC COMMISSION
- Page 6 and 7:
vPrefaceThe second EPR of Albania b
- Page 8 and 9:
viiLIST OF TEAM MEMBERSMr. Antoine
- Page 10 and 11:
ixMinistry of Agriculture, Food and
- Page 12 and 13:
xiCONTENTSForeword ................
- Page 14 and 15:
8.3 Biological diversity ..........
- Page 16 and 17:
xvPageChapter 8Table 8.1:Table 8.2:
- Page 18 and 19:
xviiPageLIST OF PHOTOSIntroductionP
- Page 20 and 21:
xixLIST OF ABBREVIATIONSAICASCICANP
- Page 22 and 23:
xxiSIGNS AND MEASURES .. not availa
- Page 24 and 25:
xxiiiExecutive summaryThe first Env
- Page 26 and 27:
The entire education system is subj
- Page 28 and 29:
was done by international consultan
- Page 30 and 31:
1Introduction I.1 Physical contextA
- Page 32 and 33:
Introduction3The country has deposi
- Page 34 and 35:
Introduction5Photo I.1: Ruins of Sk
- Page 36:
PART I: POLICYMAKING, PLANNING AND
- Page 39 and 40:
10 Part I: Policymaking, planning a
- Page 41 and 42:
12 Part I: Policymaking, planning a
- Page 43 and 44:
14 Part I: Policymaking, planning a
- Page 45 and 46:
16 Part I: Policymaking, planning a
- Page 47 and 48:
18 Part I: Policymaking, planning a
- Page 49 and 50:
20 Part I: Policymaking, planning a
- Page 51 and 52:
22 Part I: Policymaking, planning a
- Page 53 and 54:
24 Part I: Policymaking, planning a
- Page 55 and 56:
26 Part I: Policymaking, planning a
- Page 57 and 58:
28 Part I: Policymaking, planning a
- Page 59 and 60:
30 Part I: Policymaking, planning a
- Page 61 and 62:
32 Part I: Policymaking, planning a
- Page 63 and 64:
34 Part I: Policymaking, planning a
- Page 65 and 66:
36 Part I: Policymaking, planning a
- Page 67 and 68:
38 Part I: Policymaking, planning a
- Page 69 and 70:
40 Part I: Policymaking, planning a
- Page 71 and 72:
42 Part I: Policymaking, planning a
- Page 73 and 74:
44 Part I: Policymaking, planning a
- Page 75 and 76:
46 Part I: Policymaking, planning a
- Page 77 and 78:
48 Part I: Policymaking, planning a
- Page 79 and 80:
50 Part I: Policymaking, planning a
- Page 81 and 82:
52 Part I: Policymaking, planning a
- Page 83 and 84:
54 Part I: Policymaking, planning a
- Page 85 and 86:
56 Part I: Policymaking, planning a
- Page 87 and 88:
58 Part I: Policymaking, planning a
- Page 89 and 90:
60 Part I: Policymaking, planning a
- Page 91 and 92:
62 Part I: Policymaking, planning a
- Page 93 and 94:
64 Part I: Policymaking, planning a
- Page 96 and 97:
67Chapter 5ECONOMIC INSTRUMENTS AND
- Page 98 and 99:
Chapter 5: Economic instruments and
- Page 100 and 101:
Chapter 5: Economic instruments and
- Page 102 and 103:
Chapter 5: Economic instruments and
- Page 104 and 105:
Chapter 5: Economic instruments and
- Page 106 and 107:
Chapter 5: Economic instruments and
- Page 108:
PART III: INTEGRATION OF ENVIRONMEN
- Page 111 and 112:
82 Part III: Integration of environ
- Page 113 and 114:
84 Part III: Integration of environ
- Page 115 and 116:
86 Part III: Integration of environ
- Page 117 and 118:
88 Part III: Integration of environ
- Page 119 and 120:
90 Part III: Integration of environ
- Page 121 and 122:
92 Part III: Integration of environ
- Page 124 and 125:
95Chapter 7WASTE MANAGEMENT7.1 Intr
- Page 126 and 127:
Chapter 7: Waste management97sold f
- Page 128 and 129:
Chapter 7: Waste management99SitesC
- Page 130 and 131:
Chapter 7: Waste management101Table
- Page 132 and 133:
Chapter 7: Waste management103• C
- Page 134 and 135:
Chapter 7: Waste management105sever
- Page 136:
Chapter 7: Waste management107(b) E
- Page 139 and 140:
110 Part III: Integration of enviro
- Page 141 and 142:
112 Part III: Integration of enviro
- Page 143 and 144:
114 Part III: Integration of enviro
- Page 145 and 146:
116 Part III: Integration of enviro
- Page 147 and 148:
118 Part III: Integration of enviro
- Page 149 and 150:
120 Part III: Integration of enviro
- Page 151 and 152:
122 Part III: Integration of enviro
- Page 153 and 154:
124 Part III: Integration of enviro
- Page 155 and 156:
126 Part III: Integration of enviro
- Page 157 and 158:
128 Part III: Integration of enviro
- Page 159 and 160:
130 Part III: Integration of enviro
- Page 161 and 162: 132 Part III: Integration of enviro
- Page 164 and 165: 135Chapter 10HUMAN HEALTH AND ENVIR
- Page 166 and 167: Chapter 10: Human health and enviro
- Page 168 and 169: Chapter 10: Human health and enviro
- Page 170 and 171: Chapter 10: Human health and enviro
- Page 172 and 173: Chapter 10: Human health and enviro
- Page 174 and 175: Chapter 10: Human health and enviro
- Page 176 and 177: Chapter 10: Human health and enviro
- Page 178: Chapter 10: Human health and enviro
- Page 182 and 183: 153Annex IIMPLEMENTATION OF THE REC
- Page 184 and 185: The new 2011 Law on Environmental P
- Page 186 and 187: Recommendation 3.2:Albania needs to
- Page 188 and 189: Recommendation 4.2:The Ministry of
- Page 190 and 191: for 2004 was prepared within the St
- Page 192 and 193: 163Chapter 6: WATER MANAGEMENTRecom
- Page 194 and 195: There is no updated water resources
- Page 196 and 197: international consulting and author
- Page 198 and 199: it is limited only to the level of
- Page 200 and 201: taken. In addition, NES2, under MoE
- Page 202 and 203: 173Chapter 12: HUMAN HEALTH AND THE
- Page 204: Recommendation 12.5:(a) The Ministr
- Page 207 and 208: 178Worldwide agreementsYear1979 (BO
- Page 210 and 211: 181Annex IIISELECTED ECONOMIC AND E
- Page 214: Education 2002 2003 2004 2005 2006
- Page 217 and 218: 188Law on Local Tax System, No. 963
- Page 220 and 221: 191SourcesIndividual authors1. Bego
- Page 222 and 223: 19336. Albania, Ministry of Environ
- Page 224 and 225: 19568. National Agency of Natural R
- Page 226 and 227: 197101. International POPs Eliminat
- Page 228 and 229: 199UNDP and Ministry of Environment
- Page 230: 201172. National Agency for Environ