state of the world's cities 2012/2013 - United Nations Sustainable ...
state of the world's cities 2012/2013 - United Nations Sustainable ...
state of the world's cities 2012/2013 - United Nations Sustainable ...

You also want an ePaper? Increase the reach of your titles
YUMPU automatically turns print PDFs into web optimized ePapers that Google loves.
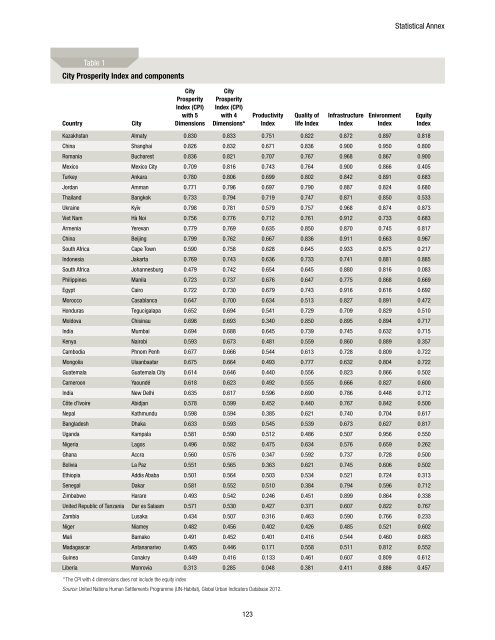
Statistical AnnexTable 1City Prosperity Index and componentsCountryCityCityProsperityIndex (CPI)with 5DimensionsCityProsperityIndex (CPI)with 4Dimensions*ProductivityIndexQuality <strong>of</strong>life IndexInfrastructureIndexEnivronmentIndexEquityIndexKazakhstan Almaty 0.830 0.833 0.751 0.822 0.872 0.897 0.818China Shanghai 0.826 0.832 0.671 0.836 0.900 0.950 0.800Romania Bucharest 0.836 0.821 0.707 0.767 0.968 0.867 0.900Mexico Mexico City 0.709 0.816 0.743 0.764 0.900 0.866 0.405Turkey Ankara 0.780 0.806 0.699 0.802 0.842 0.891 0.683Jordan Amman 0.771 0.796 0.697 0.790 0.887 0.824 0.680Thailand Bangkok 0.733 0.794 0.719 0.747 0.871 0.850 0.533Ukraine Kyïv 0.798 0.781 0.579 0.757 0.968 0.874 0.873Viet Nam Hà Noi 0.756 0.776 0.712 0.761 0.912 0.733 0.683Armenia Yerevan 0.779 0.769 0.635 0.850 0.870 0.745 0.817China Beijing 0.799 0.762 0.667 0.836 0.911 0.663 0.967South Africa Cape Town 0.590 0.758 0.628 0.645 0.933 0.875 0.217Indonesia Jakarta 0.769 0.743 0.636 0.733 0.741 0.881 0.885South Africa Johannesburg 0.479 0.742 0.654 0.645 0.880 0.816 0.083Philippines Manila 0.723 0.737 0.676 0.647 0.775 0.868 0.669Egypt Cairo 0.722 0.730 0.679 0.743 0.916 0.616 0.692Morocco Casablanca 0.647 0.700 0.634 0.513 0.827 0.891 0.472Honduras Tegucigalapa 0.652 0.694 0.541 0.729 0.709 0.829 0.510Moldova Chisinau 0.698 0.693 0.340 0.850 0.895 0.894 0.717India Mumbai 0.694 0.688 0.645 0.739 0.745 0.632 0.715Kenya Nairobi 0.593 0.673 0.481 0.559 0.860 0.889 0.357Cambodia Phnom Penh 0.677 0.666 0.544 0.613 0.728 0.809 0.722Mongolia Ulaanbaatar 0.675 0.664 0.493 0.777 0.632 0.804 0.722Guatemala Guatemala City 0.614 0.646 0.440 0.556 0.823 0.866 0.502Cameroon Yaoundé 0.618 0.623 0.492 0.555 0.666 0.827 0.600India New Delhi 0.635 0.617 0.596 0.690 0.786 0.448 0.712Côte d’Ivoire Abidjan 0.578 0.599 0.452 0.440 0.767 0.842 0.500Nepal Kathmundu 0.598 0.594 0.385 0.621 0.740 0.704 0.617Bangladesh Dhaka 0.633 0.593 0.545 0.539 0.673 0.627 0.817Uganda Kampala 0.581 0.590 0.512 0.486 0.507 0.956 0.550Nigeria Lagos 0.496 0.582 0.475 0.634 0.576 0.659 0.262Ghana Accra 0.560 0.576 0.347 0.592 0.737 0.728 0.500Bolivia La Paz 0.551 0.565 0.363 0.621 0.745 0.606 0.502Ethiopia Addis Ababa 0.501 0.564 0.503 0.534 0.521 0.724 0.313Senegal Dakar 0.581 0.552 0.510 0.384 0.794 0.596 0.712Zimbabwe Harare 0.493 0.542 0.246 0.451 0.899 0.864 0.338<strong>United</strong> Republic <strong>of</strong> Tanzania Dar es Salaam 0.571 0.530 0.427 0.371 0.607 0.822 0.767Zambia Lusaka 0.434 0.507 0.316 0.463 0.590 0.766 0.233Niger Niamey 0.482 0.456 0.402 0.426 0.485 0.521 0.602Mali Bamako 0.491 0.452 0.401 0.416 0.544 0.460 0.683Madagascar Antananarivo 0.465 0.446 0.171 0.558 0.511 0.812 0.552Guinea Conakry 0.449 0.416 0.133 0.461 0.607 0.809 0.612Liberia Monrovia 0.313 0.285 0.048 0.381 0.411 0.886 0.457* The CPI with 4 dimensions does not include <strong>the</strong> equity indexSource: <strong>United</strong> <strong>Nations</strong> Human Settlements Programme (UN-Habitat), Global Urban Indicators Database <strong>2012</strong>.123