state of the world's cities 2012/2013 - United Nations Sustainable ...
state of the world's cities 2012/2013 - United Nations Sustainable ...
state of the world's cities 2012/2013 - United Nations Sustainable ...

Create successful ePaper yourself
Turn your PDF publications into a flip-book with our unique Google optimized e-Paper software.
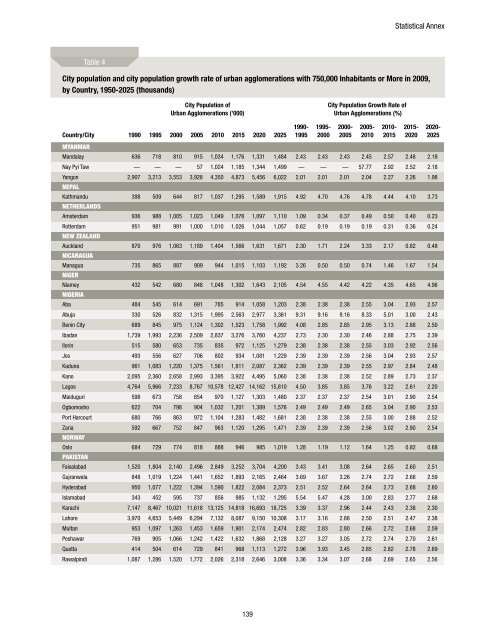
Statistical AnnexTable 4City population and city population growth rate <strong>of</strong> urban agglomerations with 750,000 Inhabitants or More in 2009,by Country, 1950-2025 (thousands)City Population <strong>of</strong>Urban Agglomerations (’000)City Population Growth Rate <strong>of</strong>Urban Agglomerations (%)Country/CityMyanmar1990 1995 2000 2005 2010 2015 2020 2025Mandalay 636 718 810 915 1,034 1,176 1,331 1,484 2.43 2.43 2.43 2.45 2.57 2.48 2.18Nay Pyi Taw — — — 57 1,024 1,185 1,344 1,499 — — — 57.77 2.92 2.52 2.18Yangon 2,907 3,213 3,553 3,928 4,350 4,873 5,456 6,022 2.01 2.01 2.01 2.04 2.27 2.26 1.98NepalKathmandu 398 509 644 817 1,037 1,295 1,589 1,915 4.92 4.70 4.76 4.78 4.44 4.10 3.73Ne<strong>the</strong>rlandsAmsterdam 936 988 1,005 1,023 1,049 1,076 1,097 1,110 1.09 0.34 0.37 0.49 0.50 0.40 0.23Rotterdam 951 981 991 1,000 1,010 1,026 1,044 1,057 0.62 0.19 0.19 0.19 0.31 0.36 0.24New ZealandAuckland 870 976 1,063 1,189 1,404 1,566 1,631 1,671 2.30 1.71 2.24 3.33 2.17 0.82 0.48NicaraguaManagua 735 865 887 909 944 1,015 1,103 1,192 3.26 0.50 0.50 0.74 1.46 1.67 1.54NigerNiamey 432 542 680 848 1,048 1,302 1,643 2,105 4.54 4.55 4.42 4.22 4.35 4.65 4.96NigeriaAba 484 545 614 691 785 914 1,058 1,203 2.38 2.38 2.38 2.55 3.04 2.93 2.57Abuja 330 526 832 1,315 1,995 2,563 2,977 3,361 9.31 9.16 9.16 8.33 5.01 3.00 2.43Benin City 689 845 975 1,124 1,302 1,523 1,758 1,992 4.08 2.85 2.85 2.95 3.13 2.88 2.50Ibadan 1,739 1,993 2,236 2,509 2,837 3,276 3,760 4,237 2.73 2.30 2.30 2.46 2.88 2.75 2.39Ilorin 515 580 653 735 835 972 1,125 1,279 2.38 2.38 2.38 2.55 3.03 2.92 2.56Jos 493 556 627 706 802 934 1,081 1,229 2.39 2.39 2.39 2.56 3.04 2.93 2.57Kaduna 961 1,083 1,220 1,375 1,561 1,811 2,087 2,362 2.39 2.39 2.39 2.55 2.97 2.84 2.48Kano 2,095 2,360 2,658 2,993 3,395 3,922 4,495 5,060 2.38 2.38 2.38 2.52 2.89 2.73 2.37Lagos 4,764 5,966 7,233 8,767 10,578 12,427 14,162 15,810 4.50 3.85 3.85 3.76 3.22 2.61 2.20Maiduguri 598 673 758 854 970 1,127 1,303 1,480 2.37 2.37 2.37 2.54 3.01 2.90 2.54Ogbomosho 622 704 798 904 1,032 1,201 1,389 1,576 2.49 2.49 2.49 2.65 3.04 2.90 2.53Port Harcourt 680 766 863 972 1,104 1,283 1,482 1,681 2.38 2.38 2.38 2.55 3.00 2.88 2.52Zaria 592 667 752 847 963 1,120 1,295 1,471 2.39 2.39 2.39 2.56 3.02 2.90 2.54NorwayOslo 684 729 774 818 888 946 985 1,019 1.28 1.19 1.12 1.64 1.25 0.82 0.68PakistanFaisalabad 1,520 1,804 2,140 2,496 2,849 3,252 3,704 4,200 3.43 3.41 3.08 2.64 2.65 2.60 2.51Gujranwala 848 1,019 1,224 1,441 1,652 1,893 2,165 2,464 3.69 3.67 3.26 2.74 2.72 2.68 2.59Hyderabad 950 1,077 1,222 1,394 1,590 1,822 2,084 2,373 2.51 2.52 2.64 2.64 2.73 2.68 2.60Islamabad 343 452 595 737 856 985 1,132 1,295 5.54 5.47 4.28 3.00 2.83 2.77 2.68Karachi 7,147 8,467 10,021 11,618 13,125 14,818 16,693 18,725 3.39 3.37 2.96 2.44 2.43 2.38 2.30Lahore 3,970 4,653 5,449 6,294 7,132 8,087 9,150 10,308 3.17 3.16 2.88 2.50 2.51 2.47 2.38Multan 953 1,097 1,263 1,453 1,659 1,901 2,174 2,474 2.82 2.83 2.80 2.66 2.72 2.68 2.59Peshawar 769 905 1,066 1,242 1,422 1,632 1,868 2,128 3.27 3.27 3.05 2.72 2.74 2.70 2.61Quetta 414 504 614 729 841 968 1,113 1,272 3.96 3.93 3.45 2.85 2.82 2.78 2.69Rawalpindi 1,087 1,286 1,520 1,772 2,026 2,318 2,646 3,008 3.36 3.34 3.07 2.68 2.69 2.65 2.561990-19951995-20002000-20052005-20102010-20152015-20202020-2025139