state of the world's cities 2012/2013 - United Nations Sustainable ...
state of the world's cities 2012/2013 - United Nations Sustainable ...
state of the world's cities 2012/2013 - United Nations Sustainable ...

You also want an ePaper? Increase the reach of your titles
YUMPU automatically turns print PDFs into web optimized ePapers that Google loves.
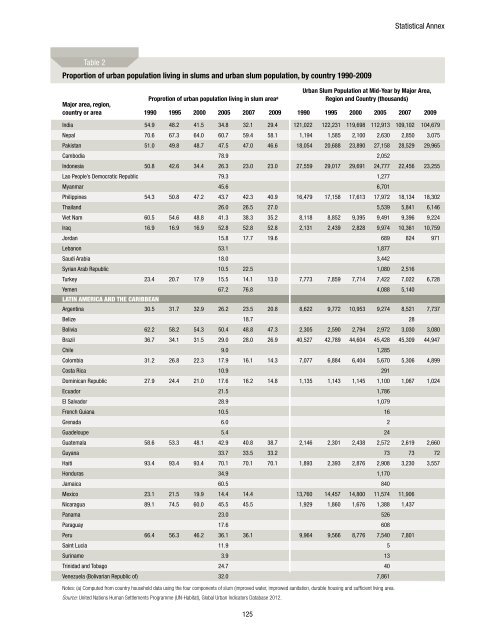
Statistical AnnexTable 2Proportion <strong>of</strong> urban population living in slums and urban slum population, by country 1990-2009Major area, region,country or areaProprotion <strong>of</strong> urban population living in slum area aUrban Slum Population at Mid-Year by Major Area,Region and Country (thousands)1990 1995 2000 2005 2007 2009 1990 1995 2000 2005 2007 2009India 54.9 48.2 41.5 34.8 32.1 29.4 121,022 122,231 119,698 112,913 109,102 104,679Nepal 70.6 67.3 64.0 60.7 59.4 58.1 1,194 1,585 2,100 2,630 2,850 3,075Pakistan 51.0 49.8 48.7 47.5 47.0 46.6 18,054 20,688 23,890 27,158 28,529 29,965Cambodia 78.9 2,052Indonesia 50.8 42.6 34.4 26.3 23.0 23.0 27,559 29,017 29,691 24,777 22,456 23,255Lao People’s Democratic Republic 79.3 1,277Myanmar 45.6 6,701Philippines 54.3 50.8 47.2 43.7 42.3 40.9 16,479 17,158 17,613 17,972 18,134 18,302Thailand 26.0 26.5 27.0 5,539 5,841 6,146Viet Nam 60.5 54.6 48.8 41.3 38.3 35.2 8,118 8,852 9,395 9,491 9,396 9,224Iraq 16.9 16.9 16.9 52.8 52.8 52.8 2,131 2,439 2,828 9,974 10,361 10,759Jordan 15.8 17.7 19.6 689 824 971Lebanon 53.1 1,877Saudi Arabia 18.0 3,442Syrian Arab Republic 10.5 22.5 1,080 2,516Turkey 23.4 20.7 17.9 15.5 14.1 13.0 7,773 7,859 7,714 7,422 7,022 6,728Yemen 67.2 76.8 4,088 5,140Latin America and <strong>the</strong> CaribbeanArgentina 30.5 31.7 32.9 26.2 23.5 20.8 8,622 9,772 10,953 9,274 8,521 7,737Belize 18.7 28Bolivia 62.2 58.2 54.3 50.4 48.8 47.3 2,305 2,590 2,794 2,972 3,030 3,080Brazil 36.7 34.1 31.5 29.0 28.0 26.9 40,527 42,789 44,604 45,428 45,309 44,947Chile 9.0 1,285Colombia 31.2 26.8 22.3 17.9 16.1 14.3 7,077 6,884 6,404 5,670 5,306 4,899Costa Rica 10.9 291Dominican Republic 27.9 24.4 21.0 17.6 16.2 14.8 1,135 1,143 1,145 1,100 1,067 1,024Ecuador 21.5 1,786El Salvador 28.9 1,079French Guiana 10.5 16Grenada 6.0 2Guadeloupe 5.4 24Guatemala 58.6 53.3 48.1 42.9 40.8 38.7 2,146 2,301 2,438 2,572 2,619 2,660Guyana 33.7 33.5 33.2 73 73 72Haiti 93.4 93.4 93.4 70.1 70.1 70.1 1,893 2,393 2,876 2,908 3,230 3,557Honduras 34.9 1,170Jamaica 60.5 840Mexico 23.1 21.5 19.9 14.4 14.4 13,760 14,457 14,800 11,574 11,906Nicaragua 89.1 74.5 60.0 45.5 45.5 1,929 1,860 1,676 1,388 1,437Panama 23.0 526Paraguay 17.6 608Peru 66.4 56.3 46.2 36.1 36.1 9,964 9,566 8,776 7,540 7,801Saint Lucia 11.9 5Suriname 3.9 13Trinidad and Tobago 24.7 40Venezuela (Bolivarian Republic <strong>of</strong>) 32.0 7,861Notes: (a) Computed from country household data using <strong>the</strong> four components <strong>of</strong> slum (improved water, improwed sanitation, durable housing and sufficient living area.Source: <strong>United</strong> <strong>Nations</strong> Human Settlements Programme (UN-Habitat), Global Urban Indicators Database <strong>2012</strong>.125