Conceptualizing Urban ProsperityTable 1.1.3The UN-Habitat City Prosperity IndexDimensionsDefinitions/variablesProductivityQuality <strong>of</strong> lifeInfrastructure developmentEnvironmental sustainabilityEquity and social inclusionThe productivity index is measured through <strong>the</strong> city product, which is composed <strong>of</strong> variables suchcapital investment, formal/informal employment, inflation, trade, savings, export/import and household income/consumption. The city product represents <strong>the</strong> total output <strong>of</strong> goods and services (value added) produced by acity’s population during a specific year (details <strong>of</strong> <strong>the</strong> methodology can be found in <strong>the</strong> complete Report).This index is a combination <strong>of</strong> three sub-indices: education, health sub-index and public space.This index combines two sub-indices: one for infrastructure proper, and ano<strong>the</strong>r for housing.This index is made <strong>of</strong> three sub-indexes: air quality (PM10), CO 2 emissions and indoor pollution.This index combines statistical measures <strong>of</strong> inequality <strong>of</strong> income/consumption, (Gini coefficient) andinequality <strong>of</strong> access to services and infrastructure.Cities with very solid prosperity factors (0.900services as well as strong economic fundamentals and highand above): In <strong>the</strong> world’s most prosperous <strong>cities</strong> <strong>the</strong>productivity. Their populations live longer and are wellfive ‘spokes’ are well-developed overall, with very little educated. Infrastructures are available and <strong>the</strong> environmentvariations among <strong>the</strong>m. Urban power functions such as is well managed. These <strong>cities</strong> are well governed and ensuregood governance, urban planning, laws, regulations and safe, secure environments. It is clear that <strong>the</strong> five ‘spokes’ <strong>of</strong>institutional frameworks ensure that no particular dimension urban prosperity are kept toge<strong>the</strong>r in balance and at a right<strong>of</strong> prosperity gains prevalence to <strong>the</strong> detriment <strong>of</strong> <strong>the</strong> o<strong>the</strong>rs. pace by a ‘hub’ that has <strong>the</strong> collective interest as its core.More specifically, <strong>the</strong>y feature high volumes <strong>of</strong> goods and When <strong>the</strong> equity index is included in <strong>the</strong> CPI, <strong>the</strong>findings show that urbanequity and prosperityare closely linked: notFigure 1.1.2unsurprisingly, <strong>cities</strong>Cities with very solid prosperity factorsthat do well on <strong>the</strong> firstCPI Index (with five dimensions) Productivity Index Infrastructure Development Index Equity IndexCPI Index (with four dimensions) Quality <strong>of</strong> Life Index1.00.90.80.70.60.50.40.30.20.10WarsawMilanBarcelonaBrusselsCopenhagenZurichAmsterdamAucklandMelbourneTokyoParisEnvironmental Sustainability IndexOsloDublinHelsinkiStockholmLondonTorontoNew YorkViennaFACTIn broad terms,<strong>the</strong> classification<strong>of</strong> <strong>cities</strong> by CPI valuesresults in regional bracketswith various <strong>cities</strong> in <strong>the</strong>developed world featuringsolid prosperity factors(CPI: 0.900 or higher), amajority <strong>of</strong> African <strong>cities</strong>with a very weak readings,constituting <strong>the</strong> last twogroups (CPI: 0.600 orbelow). In between a largenumber <strong>of</strong> Asian and LatinAmerican <strong>cities</strong> make up <strong>the</strong>third and fourth groups (withCPI values <strong>of</strong> 0.700–0.799and 0.600–0.699,respectively).19
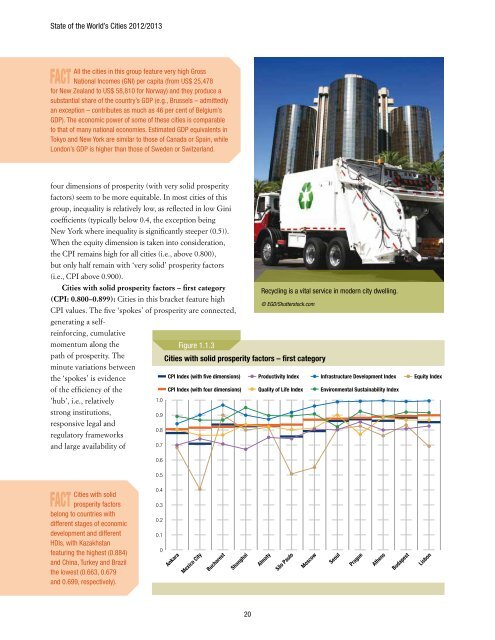
State <strong>of</strong> <strong>the</strong> World’s Cities <strong>2012</strong>/<strong>2013</strong>FACTAll <strong>the</strong> <strong>cities</strong> in this group feature very high GrossNational Incomes (GNI) per capita (from US$ 25,478for New Zealand to US$ 58,810 for Norway) and <strong>the</strong>y produce asubstantial share <strong>of</strong> <strong>the</strong> country’s GDP (e.g., Brussels – admittedlyan exception – contributes as much as 46 per cent <strong>of</strong> Belgium’sGDP). The economic power <strong>of</strong> some <strong>of</strong> <strong>the</strong>se <strong>cities</strong> is comparableto that <strong>of</strong> many national economies. Estimated GDP equivalents inTokyo and New York are similar to those <strong>of</strong> Canada or Spain, whileLondon’s GDP is higher than those <strong>of</strong> Sweden or Switzerland.four dimensions <strong>of</strong> prosperity (with very solid prosperityfactors) seem to be more equitable. In most <strong>cities</strong> <strong>of</strong> thisgroup, inequality is relatively low, as reflected in low Ginicoefficients (typically below 0.4, <strong>the</strong> exception beingNew York where inequality is significantly steeper (0.5)).When <strong>the</strong> equity dimension is taken into consideration,<strong>the</strong> CPI remains high for all <strong>cities</strong> (i.e., above 0.800),but only half remain with ‘very solid’ prosperity factors(i.e., CPI above 0.900).Cities with solid prosperity factors – first categoryRecycling is a vital service in modern city dwelling.(CPI: 0.800–0.899): Cities in this bracket feature high© EGD/Shutterstock.comCPI values. The five ‘spokes’ <strong>of</strong> prosperity are connected,generating a selfreinforcing,cumulativemomentum along <strong>the</strong>path <strong>of</strong> prosperity. Theminute variations between<strong>the</strong> ‘spokes’ is evidence<strong>of</strong> <strong>the</strong> efficiency <strong>of</strong> <strong>the</strong>’hub’, i.e., relativelystrong institutions,responsive legal andregulatory frameworksand large availability <strong>of</strong>Figure 1.1.3Cities with solid prosperity factors – first categoryCPI Index (with five dimensions) Productivity IndexCPI Index (with four dimensions) Quality <strong>of</strong> Life Index1.00.90.80.7Infrastructure Development IndexEnvironmental Sustainability IndexEquity Index0.60.5FACTCities with solidprosperity factorsbelong to countries withdifferent stages <strong>of</strong> economicdevelopment and differentHDIs, with Kazakhstanfeaturing <strong>the</strong> highest (0.884)and China, Turkey and Brazil<strong>the</strong> lowest (0.663, 0.679and 0.699, respectively).0.40.30.20.10AnkaraMexico CityBucharestShanghaiAlmatySão PauloMoscowSeoulPragueA<strong>the</strong>nsBudapestLisbon20