Statistical AnnexTable 4City population and city population growth rate <strong>of</strong> urban agglomerations with 750,000 Inhabitants or More in 2009,by Country, 1950-2025 (thousands)City Population <strong>of</strong>Urban Agglomerations (’000)City Population Growth Rate <strong>of</strong>Urban Agglomerations (%)Country/City<strong>United</strong> States <strong>of</strong> America1990 1995 2000 2005 2010 2015 2020 2025Atlanta 2,184 2,781 3,542 4,306 4,691 4,886 5,036 5,153 4.84 4.84 3.90 1.72 0.81 0.60 0.46Austin 569 720 913 1,107 1,215 1,277 1,329 1,373 4.73 4.73 3.87 1.85 1.00 0.80 0.65Baltimore 1,849 1,962 2,083 2,206 2,320 2,421 2,508 2,579 1.19 1.19 1.15 1.01 0.85 0.70 0.56Boston 3,428 3,726 4,049 4,363 4,593 4,773 4,920 5,034 1.66 1.66 1.49 1.03 0.77 0.61 0.46Bridgeport-Stamford 714 799 894 987 1,055 1,108 1,154 1,193 2.25 2.25 1.99 1.32 0.98 0.82 0.67Buffalo 955 966 977 1,000 1,045 1,096 1,142 1,181 0.23 0.23 0.45 0.89 0.95 0.82 0.67Charlotte 461 596 769 946 1,043 1,098 1,144 1,183 5.10 5.10 4.16 1.94 1.03 0.82 0.67Chicago 7,374 7,839 8,333 8,818 9,204 9,513 9,758 9,936 1.22 1.22 1.13 0.86 0.66 0.51 0.36Cincinnati 1,335 1,419 1,508 1,600 1,686 1,764 1,831 1,887 1.22 1.22 1.19 1.05 0.90 0.75 0.60Cleveland 1,680 1,734 1,789 1,856 1,942 2,029 2,104 2,166 0.63 0.63 0.73 0.90 0.87 0.73 0.58Columbus, Ohio 950 1,040 1,138 1,236 1,313 1,376 1,432 1,478 1.81 1.81 1.65 1.21 0.95 0.79 0.64Dallas-Fort Worth 3,219 3,665 4,172 4,657 4,951 5,145 5,301 5,421 2.59 2.59 2.20 1.22 0.77 0.60 0.45Dayton 616 659 706 754 800 841 878 909 1.37 1.37 1.33 1.17 1.01 0.86 0.71Denver-Aurora 1,528 1,747 1,998 2,240 2,394 2,501 2,590 2,662 2.68 2.68 2.29 1.33 0.87 0.70 0.55Detroit 3,703 3,804 3,909 4,036 4,200 4,363 4,500 4,608 0.54 0.54 0.64 0.80 0.76 0.62 0.47El Paso 573 623 678 732 779 820 856 887 1.67 1.67 1.56 1.23 1.02 0.86 0.71Hartford 783 818 853 894 942 989 1,031 1,067 0.86 0.86 0.93 1.04 0.98 0.83 0.68Honolulu 635 676 720 767 812 854 891 923 1.27 1.27 1.25 1.14 1.00 0.85 0.71Houston 2,922 3,353 3,849 4,322 4,605 4,789 4,937 5,051 2.76 2.76 2.32 1.27 0.78 0.61 0.46Indianapolis 921 1,063 1,228 1,387 1,490 1,562 1,623 1,674 2.87 2.87 2.45 1.42 0.94 0.77 0.62Jacksonville, Florida 742 811 886 962 1,022 1,074 1,119 1,157 1.78 1.78 1.63 1.23 0.98 0.82 0.67Kansas City 1,233 1,297 1,365 1,438 1,513 1,584 1,645 1,697 1.02 1.02 1.04 1.02 0.91 0.77 0.62Las Vegas 708 973 1,335 1,721 1,916 2,011 2,086 2,147 6.34 6.34 5.08 2.14 0.97 0.73 0.58Los Angeles-Long Beach-Santa Ana10,883 11,339 11,814 12,303 12,762 13,156 13,463 13,677 0.82 0.82 0.81 0.73 0.61 0.46 0.32Louisville 757 810 866 925 979 1,028 1,071 1,108 1.34 1.34 1.30 1.14 0.98 0.83 0.68McAllen 268 377 532 701 789 833 870 901 6.87 6.87 5.51 2.36 1.10 0.86 0.71Memphis 829 899 976 1,053 1,117 1,173 1,221 1,262 1.64 1.64 1.52 1.19 0.97 0.81 0.66Miami 3,969 4,431 4,946 5,436 5,750 5,967 6,142 6,275 2.20 2.20 1.89 1.12 0.74 0.58 0.43Milwaukee 1,228 1,269 1,311 1,362 1,428 1,495 1,554 1,603 0.65 0.65 0.76 0.94 0.91 0.77 0.63Minneapolis-St. Paul 2,087 2,236 2,397 2,557 2,693 2,808 2,905 2,984 1.38 1.39 1.30 1.03 0.84 0.68 0.54Nashville-Davidson 577 660 755 848 911 958 999 1,034 2.69 2.69 2.32 1.44 1.01 0.84 0.69New Orleans 1,039 1,024 1,009 996 858 921 984 1,044 -0.30 -0.30 -0.26 -2.99 1.43 1.33 1.18New York-Newark 16,086 16,943 17,846 18,727 19,425 19,968 20,374 20,636 1.04 1.04 0.96 0.73 0.55 0.40 0.26Oklahoma City 711 729 748 773 812 854 891 923 0.51 0.51 0.67 0.98 0.99 0.85 0.71Orlando 893 1,020 1,165 1,306 1,400 1,468 1,526 1,575 2.66 2.66 2.29 1.38 0.95 0.78 0.63Philadelphia 4,725 4,938 5,160 5,395 5,626 5,833 6,004 6,135 0.88 0.88 0.89 0.84 0.72 0.58 0.43Phoenix-Mesa 2,025 2,437 2,934 3,418 3,684 3,840 3,965 4,063 3.71 3.71 3.05 1.50 0.83 0.64 0.49Pittsburgh 1,681 1,717 1,755 1,807 1,887 1,971 2,045 2,106 0.43 0.43 0.58 0.87 0.87 0.73 0.59Portland 1,181 1,372 1,595 1,811 1,944 2,035 2,110 2,173 3.01 3.01 2.54 1.42 0.91 0.73 0.58Providence 1,047 1,111 1,178 1,249 1,317 1,380 1,435 1,482 1.18 1.18 1.16 1.07 0.93 0.79 0.64Raleigh 310 413 549 692 769 812 848 879 5.71 5.71 4.63 2.11 1.08 0.86 0.71Richmond 696 757 822 888 944 991 1,034 1,070 1.66 1.66 1.54 1.21 0.99 0.83 0.681990-19951995-20002000-20052005-20102010-20152015-20202020-2025143
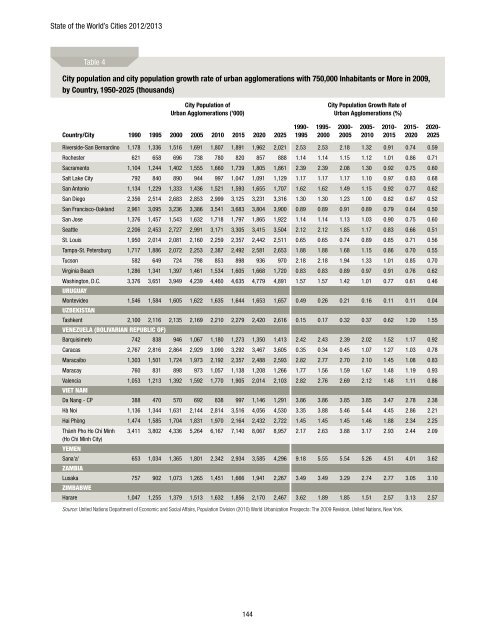
State <strong>of</strong> <strong>the</strong> World’s Cities <strong>2012</strong>/<strong>2013</strong>Table 4City population and city population growth rate <strong>of</strong> urban agglomerations with 750,000 Inhabitants or More in 2009,by Country, 1950-2025 (thousands)City Population <strong>of</strong>Urban Agglomerations (’000)City Population Growth Rate <strong>of</strong>Urban Agglomerations (%)Country/City1990 1995 2000 2005 2010 2015 2020 20251990-19951995-20002000-20052005-20102010-20152015-20202020-2025Riverside-San Bernardino 1,178 1,336 1,516 1,691 1,807 1,891 1,962 2,021 2.53 2.53 2.18 1.32 0.91 0.74 0.59Rochester 621 658 696 738 780 820 857 888 1.14 1.14 1.15 1.12 1.01 0.86 0.71Sacramento 1,104 1,244 1,402 1,555 1,660 1,739 1,805 1,861 2.39 2.39 2.08 1.30 0.92 0.75 0.60Salt Lake City 792 840 890 944 997 1,047 1,091 1,129 1.17 1.17 1.17 1.10 0.97 0.83 0.68San Antonio 1,134 1,229 1,333 1,436 1,521 1,593 1,655 1,707 1.62 1.62 1.49 1.15 0.92 0.77 0.62San Diego 2,356 2,514 2,683 2,853 2,999 3,125 3,231 3,316 1.30 1.30 1.23 1.00 0.82 0.67 0.52San Francisco-Oakland 2,961 3,095 3,236 3,386 3,541 3,683 3,804 3,900 0.89 0.89 0.91 0.89 0.79 0.64 0.50San Jose 1,376 1,457 1,543 1,632 1,718 1,797 1,865 1,922 1.14 1.14 1.13 1.03 0.90 0.75 0.60Seattle 2,206 2,453 2,727 2,991 3,171 3,305 3,415 3,504 2.12 2.12 1.85 1.17 0.83 0.66 0.51St. Louis 1,950 2,014 2,081 2,160 2,259 2,357 2,442 2,511 0.65 0.65 0.74 0.89 0.85 0.71 0.56Tampa-St. Petersburg 1,717 1,886 2,072 2,253 2,387 2,492 2,581 2,653 1.88 1.88 1.68 1.15 0.86 0.70 0.55Tucson 582 649 724 798 853 898 936 970 2.18 2.18 1.94 1.33 1.01 0.85 0.70Virginia Beach 1,286 1,341 1,397 1,461 1,534 1,605 1,668 1,720 0.83 0.83 0.89 0.97 0.91 0.76 0.62Washington, D.C. 3,376 3,651 3,949 4,239 4,460 4,635 4,779 4,891 1.57 1.57 1.42 1.01 0.77 0.61 0.46UruguayMontevideo 1,546 1,584 1,605 1,622 1,635 1,644 1,653 1,657 0.49 0.26 0.21 0.16 0.11 0.11 0.04UzbekistanTashkent 2,100 2,116 2,135 2,169 2,210 2,279 2,420 2,616 0.15 0.17 0.32 0.37 0.62 1.20 1.55Venezuela (Bolivarian Republic <strong>of</strong>)Barquisimeto 742 838 946 1,067 1,180 1,273 1,350 1,413 2.42 2.43 2.39 2.02 1.52 1.17 0.92Caracas 2,767 2,816 2,864 2,929 3,090 3,292 3,467 3,605 0.35 0.34 0.45 1.07 1.27 1.03 0.78Maracaibo 1,303 1,501 1,724 1,973 2,192 2,357 2,488 2,593 2.82 2.77 2.70 2.10 1.45 1.08 0.83Maracay 760 831 898 973 1,057 1,138 1,208 1,266 1.77 1.56 1.59 1.67 1.48 1.19 0.93Valencia 1,053 1,213 1,392 1,592 1,770 1,905 2,014 2,103 2.82 2.76 2.69 2.12 1.48 1.11 0.86Viet NamDa Nang - CP 388 470 570 692 838 997 1,146 1,291 3.86 3.86 3.85 3.85 3.47 2.78 2.38Hà Noi 1,136 1,344 1,631 2,144 2,814 3,516 4,056 4,530 3.35 3.88 5.46 5.44 4.45 2.86 2.21Hai Phòng 1,474 1,585 1,704 1,831 1,970 2,164 2,432 2,722 1.45 1.45 1.45 1.46 1.88 2.34 2.25Thành Pho Ho Chí Minh 3,411 3,802 4,336 5,264 6,167 7,140 8,067 8,957 2.17 2.63 3.88 3.17 2.93 2.44 2.09(Ho Chi Minh City)YemenSana'a' 653 1,034 1,365 1,801 2,342 2,934 3,585 4,296 9.18 5.55 5.54 5.26 4.51 4.01 3.62ZambiaLusaka 757 902 1,073 1,265 1,451 1,666 1,941 2,267 3.49 3.49 3.29 2.74 2.77 3.05 3.10ZimbabweHarare 1,047 1,255 1,379 1,513 1,632 1,856 2,170 2,467 3.62 1.89 1.85 1.51 2.57 3.13 2.57Source: <strong>United</strong> <strong>Nations</strong> Department <strong>of</strong> Economic and Social Affairs, Population Division (2010) World Urbanization Prospects: The 2009 Revision, <strong>United</strong> <strong>Nations</strong>, New York.144