Urban Infrastructure: Bedrock <strong>of</strong> Prosperityroad infrastructure in Africa poses a major challenge tomobility and prosperity and is an important source <strong>of</strong>congestion. In addition to this, poor maintenance is a majorproblem: only 18.5 per cent <strong>of</strong> experts across African <strong>cities</strong>believe that infrastructure is systematically maintained.Some African <strong>cities</strong> have taken innovative steps toenhance mobility and tackle traffic congestion. Lagosintroduced Bus Rapid Transit (BRT) in 2008. South Africa’sGauteng Province launched in 2010 <strong>the</strong> ‘Gautrain’, a <strong>state</strong><strong>of</strong>-<strong>the</strong>-art80-km mass rapid transit railway system. Citieslike Nairobi and Dakar have achieved significant progressin <strong>the</strong> development <strong>of</strong> road infrastructure increasingprosperity prospects.Significant improvements in road infrastructure inAsian <strong>cities</strong>: In recent years, various Asian countries haveembarked on ambitious programmes <strong>of</strong> road developmentand expansion. In 1997, India started <strong>the</strong> GoldenQuadrilateral motorway to connect <strong>the</strong> country’s largest<strong>cities</strong> – Kolkata, Delhi, Mumbai and Chennai. An East-West corridor has also been recently completed, not justimproving connections between <strong>cities</strong> but also opening up<strong>the</strong> hinterlands. In China, <strong>cities</strong> have been at <strong>the</strong> forefront<strong>of</strong> massive infrastructure development with emphasis onnew roads and subway systems. The urban road networkmore than doubled between 1990 and 2003, 19 largelycontributing to urbanization and economic growth. Citieslike Beijing and Shanghai have extended infrastructure tosuburban areas in a bid to match spatial expansion. Beijingcurrently allocates 30 per cent <strong>of</strong> its construction budget tomass transit 20 and Shanghai spends 10 per cent <strong>of</strong> its GDPon infrastructure, <strong>of</strong> which 40 per cent is for transportation.Singapore’s public transportation system is considered to beone <strong>of</strong> <strong>the</strong> most integrated and well-planned in <strong>the</strong> world.In addition, adequate facilities are provided for pedestrianswith a safe and comfortablewalking environment thatenhances quality <strong>of</strong> life.In major AsianMassive economicfact <strong>cities</strong>, somegrowth in Asia, particularly11 per cent <strong>of</strong> landspace is devoted toChina and India, hasroads, well below <strong>the</strong> spurred spectacular20–30 per cent rate increases in <strong>the</strong> numberscommon in US <strong>cities</strong>. 21 <strong>of</strong> motor vehicles. ThisIn Indian <strong>cities</strong>, <strong>the</strong>has contributed to trafficproportion varies fromcongestion, air and21 per cent in Delhi to11 per cent in Mumbai noise pollution, roadto five per cent inaccidents and energy useKolkata. 22in <strong>the</strong> region. In India,factA notable feature <strong>of</strong> <strong>the</strong> transport system in African <strong>cities</strong>is <strong>the</strong> virtual absence <strong>of</strong> State-operated public transport.The private sector is <strong>the</strong> major provider <strong>of</strong> transport services,<strong>of</strong>ten in <strong>the</strong> form <strong>of</strong> secondhand mini- and microbuses, sharedtaxis, and more recently commercial motorcycles. 17 The needs <strong>of</strong>pedestrians are hardly taken into consideration despite <strong>the</strong> factthat walking accounts for over 60–70 per cent <strong>of</strong> trips in <strong>cities</strong>such as Conakry, Douala or Kinshasa. 18<strong>the</strong> number <strong>of</strong> passengerIn India, publicvehicles increased by ninefact transport accountsmillion, or 12.9 per cent,for only 22 per centbetween 2007 and 2008. 23 <strong>of</strong> urban trips amongIn China, <strong>the</strong> number <strong>of</strong>ever-increasing numbersvehicles increased 10-fold <strong>of</strong> private vehicles. 24 Abetween 1990 and 2002; <strong>of</strong> greater proportion <strong>of</strong> <strong>the</strong>sevehicles are concentratedparticular significance is <strong>the</strong>in only a few <strong>cities</strong>: Newincrease in motorcycles andDelhi, Mumbai, Kolkatascooters, which increased and Bangalore, which hostfrom just 200,000 in 1981 five per cent <strong>of</strong> India’sto 50 million in 2002.population but 14 per centLatin America and<strong>of</strong> registered vehicles. 25<strong>the</strong> Caribbean regionfeatures <strong>the</strong> highest level<strong>of</strong> motorization in <strong>the</strong>Cities mustdeveloping world: <strong>the</strong>policy address <strong>the</strong>region has five times more road congestion problemscars than sub-Saharanthat adversely affect <strong>the</strong>irAfrica and Asia, andprosperityabout twice as many as <strong>the</strong>Middle East and NorthAfrica. 26 Motorizationin <strong>the</strong> region increased from 100 vehicles per 1,000 in1990 to 155 in 2005, before reaching 169:1,000 in 2008.Rising incomes, expanding middle classes, high levels <strong>of</strong>urbanization, an expanding local automobile industry, andavailability <strong>of</strong> low-cost vehicles are <strong>the</strong> major forces drivingmotorization in <strong>the</strong> region. As a result, <strong>cities</strong> in <strong>the</strong> regionexperience severe traffic congestion. A great majority<strong>of</strong> experts in <strong>the</strong> UN-Habitat survey (over 80 per cent)indicate that <strong>the</strong> roads in <strong>the</strong>ir respective <strong>cities</strong> arecongested, costing <strong>the</strong> region USD2.2 billion a year in lostproductivity. 27 Time spent in traffic deteriorates quality<strong>of</strong> life, causing pollution, traffic accidents, increased fuelconsumption and emission <strong>of</strong> greenhouse gases.In São Paulo, public transport as a share <strong>of</strong> all tripsdeclined from 46 per cent in 1977 to 33 per cent in 1997 and53
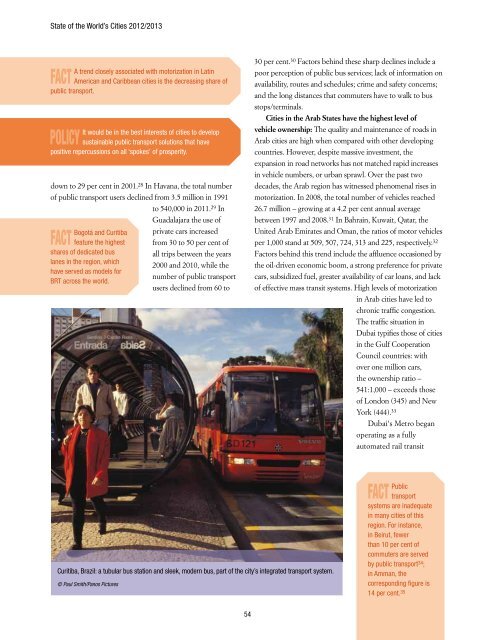
State <strong>of</strong> <strong>the</strong> World’s Cities <strong>2012</strong>/<strong>2013</strong>factA trend closely associated with motorization in LatinAmerican and Caribbean <strong>cities</strong> is <strong>the</strong> decreasing share <strong>of</strong>public transport.policyIt would be in <strong>the</strong> best interests <strong>of</strong> <strong>cities</strong> to developsustainable public transport solutions that havepositive repercussions on all ‘spokes’ <strong>of</strong> prosperity.down to 29 per cent in 2001. 28 In Havana, <strong>the</strong> total number<strong>of</strong> public transport users declined from 3.5 million in 1991factBogotá and Curitibafeature <strong>the</strong> highestshares <strong>of</strong> dedicated buslanes in <strong>the</strong> region, whichhave served as models forBRT across <strong>the</strong> world.to 540,000 in 2011. 29 InGuadalajara <strong>the</strong> use <strong>of</strong>private cars increasedfrom 30 to 50 per cent <strong>of</strong>all trips between <strong>the</strong> years2000 and 2010, while <strong>the</strong>number <strong>of</strong> public transportusers declined from 60 to30 per cent. 30 Factors behind <strong>the</strong>se sharp declines include apoor perception <strong>of</strong> public bus services; lack <strong>of</strong> information onavailability, routes and schedules; crime and safety concerns;and <strong>the</strong> long distances that commuters have to walk to busstops/terminals.Cities in <strong>the</strong> Arab States have <strong>the</strong> highest level <strong>of</strong>vehicle ownership: The quality and maintenance <strong>of</strong> roads inArab <strong>cities</strong> are high when compared with o<strong>the</strong>r developingcountries. However, despite massive investment, <strong>the</strong>expansion in road networks has not matched rapid increasesin vehicle numbers, or urban sprawl. Over <strong>the</strong> past twodecades, <strong>the</strong> Arab region has witnessed phenomenal rises inmotorization. In 2008, <strong>the</strong> total number <strong>of</strong> vehicles reached26.7 million – growing at a 4.2 per cent annual averagebetween 1997 and 2008. 31 In Bahrain, Kuwait, Qatar, <strong>the</strong><strong>United</strong> Arab Emirates and Oman, <strong>the</strong> ratios <strong>of</strong> motor vehiclesper 1,000 stand at 509, 507, 724, 313 and 225, respectively. 32Factors behind this trend include <strong>the</strong> affluence occasioned by<strong>the</strong> oil-driven economic boom, a strong preference for privatecars, subsidized fuel, greater availability <strong>of</strong> car loans, and lack<strong>of</strong> effective mass transit systems. High levels <strong>of</strong> motorizationin Arab <strong>cities</strong> have led tochronic traffic congestion.The traffic situation inDubai typifies those <strong>of</strong> <strong>cities</strong>in <strong>the</strong> Gulf CooperationCouncil countries: withover one million cars,<strong>the</strong> ownership ratio –541:1,000 – exceeds those<strong>of</strong> London (345) and NewYork (444). 33Dubai‘s Metro beganoperating as a fullyautomated rail transitCuritiba, Brazil: a tubular bus station and sleek, modern bus, part <strong>of</strong> <strong>the</strong> city’s integrated transport system.© Paul Smith/Panos Picturesfact Publictransportsystems are inadequatein many <strong>cities</strong> <strong>of</strong> thisregion. For instance,in Beirut, fewerthan 10 per cent <strong>of</strong>commuters are servedby public transport 34 ;in Amman, <strong>the</strong>corresponding figure is14 per cent. 3554