state of the world's cities 2012/2013 - United Nations Sustainable ...
state of the world's cities 2012/2013 - United Nations Sustainable ...
state of the world's cities 2012/2013 - United Nations Sustainable ...

You also want an ePaper? Increase the reach of your titles
YUMPU automatically turns print PDFs into web optimized ePapers that Google loves.
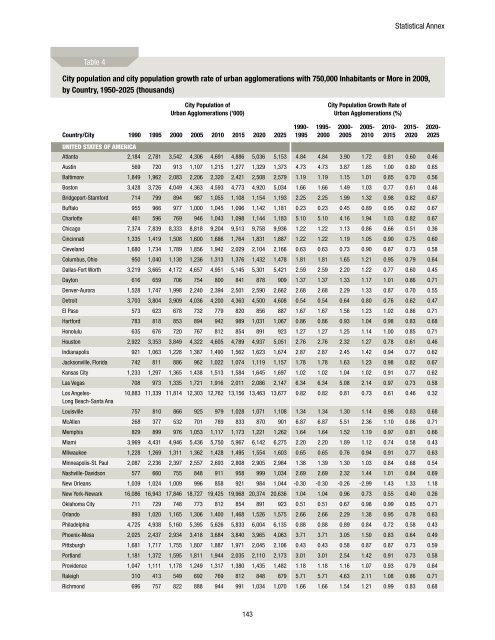
Statistical AnnexTable 4City population and city population growth rate <strong>of</strong> urban agglomerations with 750,000 Inhabitants or More in 2009,by Country, 1950-2025 (thousands)City Population <strong>of</strong>Urban Agglomerations (’000)City Population Growth Rate <strong>of</strong>Urban Agglomerations (%)Country/City<strong>United</strong> States <strong>of</strong> America1990 1995 2000 2005 2010 2015 2020 2025Atlanta 2,184 2,781 3,542 4,306 4,691 4,886 5,036 5,153 4.84 4.84 3.90 1.72 0.81 0.60 0.46Austin 569 720 913 1,107 1,215 1,277 1,329 1,373 4.73 4.73 3.87 1.85 1.00 0.80 0.65Baltimore 1,849 1,962 2,083 2,206 2,320 2,421 2,508 2,579 1.19 1.19 1.15 1.01 0.85 0.70 0.56Boston 3,428 3,726 4,049 4,363 4,593 4,773 4,920 5,034 1.66 1.66 1.49 1.03 0.77 0.61 0.46Bridgeport-Stamford 714 799 894 987 1,055 1,108 1,154 1,193 2.25 2.25 1.99 1.32 0.98 0.82 0.67Buffalo 955 966 977 1,000 1,045 1,096 1,142 1,181 0.23 0.23 0.45 0.89 0.95 0.82 0.67Charlotte 461 596 769 946 1,043 1,098 1,144 1,183 5.10 5.10 4.16 1.94 1.03 0.82 0.67Chicago 7,374 7,839 8,333 8,818 9,204 9,513 9,758 9,936 1.22 1.22 1.13 0.86 0.66 0.51 0.36Cincinnati 1,335 1,419 1,508 1,600 1,686 1,764 1,831 1,887 1.22 1.22 1.19 1.05 0.90 0.75 0.60Cleveland 1,680 1,734 1,789 1,856 1,942 2,029 2,104 2,166 0.63 0.63 0.73 0.90 0.87 0.73 0.58Columbus, Ohio 950 1,040 1,138 1,236 1,313 1,376 1,432 1,478 1.81 1.81 1.65 1.21 0.95 0.79 0.64Dallas-Fort Worth 3,219 3,665 4,172 4,657 4,951 5,145 5,301 5,421 2.59 2.59 2.20 1.22 0.77 0.60 0.45Dayton 616 659 706 754 800 841 878 909 1.37 1.37 1.33 1.17 1.01 0.86 0.71Denver-Aurora 1,528 1,747 1,998 2,240 2,394 2,501 2,590 2,662 2.68 2.68 2.29 1.33 0.87 0.70 0.55Detroit 3,703 3,804 3,909 4,036 4,200 4,363 4,500 4,608 0.54 0.54 0.64 0.80 0.76 0.62 0.47El Paso 573 623 678 732 779 820 856 887 1.67 1.67 1.56 1.23 1.02 0.86 0.71Hartford 783 818 853 894 942 989 1,031 1,067 0.86 0.86 0.93 1.04 0.98 0.83 0.68Honolulu 635 676 720 767 812 854 891 923 1.27 1.27 1.25 1.14 1.00 0.85 0.71Houston 2,922 3,353 3,849 4,322 4,605 4,789 4,937 5,051 2.76 2.76 2.32 1.27 0.78 0.61 0.46Indianapolis 921 1,063 1,228 1,387 1,490 1,562 1,623 1,674 2.87 2.87 2.45 1.42 0.94 0.77 0.62Jacksonville, Florida 742 811 886 962 1,022 1,074 1,119 1,157 1.78 1.78 1.63 1.23 0.98 0.82 0.67Kansas City 1,233 1,297 1,365 1,438 1,513 1,584 1,645 1,697 1.02 1.02 1.04 1.02 0.91 0.77 0.62Las Vegas 708 973 1,335 1,721 1,916 2,011 2,086 2,147 6.34 6.34 5.08 2.14 0.97 0.73 0.58Los Angeles-Long Beach-Santa Ana10,883 11,339 11,814 12,303 12,762 13,156 13,463 13,677 0.82 0.82 0.81 0.73 0.61 0.46 0.32Louisville 757 810 866 925 979 1,028 1,071 1,108 1.34 1.34 1.30 1.14 0.98 0.83 0.68McAllen 268 377 532 701 789 833 870 901 6.87 6.87 5.51 2.36 1.10 0.86 0.71Memphis 829 899 976 1,053 1,117 1,173 1,221 1,262 1.64 1.64 1.52 1.19 0.97 0.81 0.66Miami 3,969 4,431 4,946 5,436 5,750 5,967 6,142 6,275 2.20 2.20 1.89 1.12 0.74 0.58 0.43Milwaukee 1,228 1,269 1,311 1,362 1,428 1,495 1,554 1,603 0.65 0.65 0.76 0.94 0.91 0.77 0.63Minneapolis-St. Paul 2,087 2,236 2,397 2,557 2,693 2,808 2,905 2,984 1.38 1.39 1.30 1.03 0.84 0.68 0.54Nashville-Davidson 577 660 755 848 911 958 999 1,034 2.69 2.69 2.32 1.44 1.01 0.84 0.69New Orleans 1,039 1,024 1,009 996 858 921 984 1,044 -0.30 -0.30 -0.26 -2.99 1.43 1.33 1.18New York-Newark 16,086 16,943 17,846 18,727 19,425 19,968 20,374 20,636 1.04 1.04 0.96 0.73 0.55 0.40 0.26Oklahoma City 711 729 748 773 812 854 891 923 0.51 0.51 0.67 0.98 0.99 0.85 0.71Orlando 893 1,020 1,165 1,306 1,400 1,468 1,526 1,575 2.66 2.66 2.29 1.38 0.95 0.78 0.63Philadelphia 4,725 4,938 5,160 5,395 5,626 5,833 6,004 6,135 0.88 0.88 0.89 0.84 0.72 0.58 0.43Phoenix-Mesa 2,025 2,437 2,934 3,418 3,684 3,840 3,965 4,063 3.71 3.71 3.05 1.50 0.83 0.64 0.49Pittsburgh 1,681 1,717 1,755 1,807 1,887 1,971 2,045 2,106 0.43 0.43 0.58 0.87 0.87 0.73 0.59Portland 1,181 1,372 1,595 1,811 1,944 2,035 2,110 2,173 3.01 3.01 2.54 1.42 0.91 0.73 0.58Providence 1,047 1,111 1,178 1,249 1,317 1,380 1,435 1,482 1.18 1.18 1.16 1.07 0.93 0.79 0.64Raleigh 310 413 549 692 769 812 848 879 5.71 5.71 4.63 2.11 1.08 0.86 0.71Richmond 696 757 822 888 944 991 1,034 1,070 1.66 1.66 1.54 1.21 0.99 0.83 0.681990-19951995-20002000-20052005-20102010-20152015-20202020-2025143