state of the world's cities 2012/2013 - United Nations Sustainable ...
state of the world's cities 2012/2013 - United Nations Sustainable ...
state of the world's cities 2012/2013 - United Nations Sustainable ...

You also want an ePaper? Increase the reach of your titles
YUMPU automatically turns print PDFs into web optimized ePapers that Google loves.
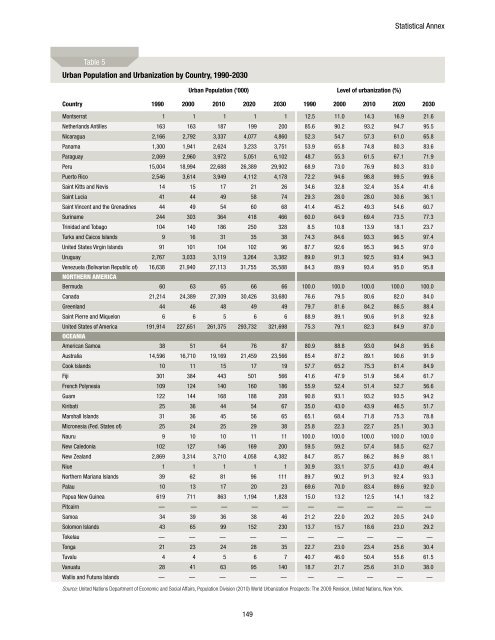
Statistical AnnexTable 5Urban Population and Urbanization by Country, 1990-2030Urban Population (’000) Level <strong>of</strong> urbanization (%)Country 1990 2000 2010 2020 2030 1990 2000 2010 2020 2030Montserrat 1 1 1 1 1 12.5 11.0 14.3 16.9 21.6Ne<strong>the</strong>rlands Antilles 163 163 187 199 200 85.6 90.2 93.2 94.7 95.5Nicaragua 2,166 2,792 3,337 4,077 4,860 52.3 54.7 57.3 61.0 65.8Panama 1,300 1,941 2,624 3,233 3,751 53.9 65.8 74.8 80.3 83.6Paraguay 2,069 2,960 3,972 5,051 6,102 48.7 55.3 61.5 67.1 71.9Peru 15,004 18,994 22,688 26,389 29,902 68.9 73.0 76.9 80.3 83.0Puerto Rico 2,546 3,614 3,949 4,112 4,178 72.2 94.6 98.8 99.5 99.6Saint Kitts and Nevis 14 15 17 21 26 34.6 32.8 32.4 35.4 41.6Saint Lucia 41 44 49 58 74 29.3 28.0 28.0 30.6 36.1Saint Vincent and <strong>the</strong> Grenadines 44 49 54 60 68 41.4 45.2 49.3 54.6 60.7Suriname 244 303 364 418 466 60.0 64.9 69.4 73.5 77.3Trinidad and Tobago 104 140 186 250 328 8.5 10.8 13.9 18.1 23.7Turks and Caicos Islands 9 16 31 35 38 74.3 84.6 93.3 96.5 97.4<strong>United</strong> States Virgin Islands 91 101 104 102 96 87.7 92.6 95.3 96.5 97.0Uruguay 2,767 3,033 3,119 3,264 3,382 89.0 91.3 92.5 93.4 94.3Venezuela (Bolivarian Republic <strong>of</strong>) 16,638 21,940 27,113 31,755 35,588 84.3 89.9 93.4 95.0 95.8Nor<strong>the</strong>rn AmericaBermuda 60 63 65 66 66 100.0 100.0 100.0 100.0 100.0Canada 21,214 24,389 27,309 30,426 33,680 76.6 79.5 80.6 82.0 84.0Greenland 44 46 48 49 49 79.7 81.6 84.2 86.5 88.4Saint Pierre and Miquelon 6 6 5 6 6 88.9 89.1 90.6 91.8 92.8<strong>United</strong> States <strong>of</strong> America 191,914 227,651 261,375 293,732 321,698 75.3 79.1 82.3 84.9 87.0OceaniaAmerican Samoa 38 51 64 76 87 80.9 88.8 93.0 94.8 95.6Australia 14,596 16,710 19,169 21,459 23,566 85.4 87.2 89.1 90.6 91.9Cook Islands 10 11 15 17 19 57.7 65.2 75.3 81.4 84.9Fiji 301 384 443 501 566 41.6 47.9 51.9 56.4 61.7French Polynesia 109 124 140 160 186 55.9 52.4 51.4 52.7 56.6Guam 122 144 168 188 208 90.8 93.1 93.2 93.5 94.2Kiribati 25 36 44 54 67 35.0 43.0 43.9 46.5 51.7Marshall Islands 31 36 45 56 65 65.1 68.4 71.8 75.3 78.8Micronesia (Fed. States <strong>of</strong>) 25 24 25 29 38 25.8 22.3 22.7 25.1 30.3Nauru 9 10 10 11 11 100.0 100.0 100.0 100.0 100.0New Caledonia 102 127 146 169 200 59.5 59.2 57.4 58.5 62.7New Zealand 2,869 3,314 3,710 4,058 4,382 84.7 85.7 86.2 86.9 88.1Niue 1 1 1 1 1 30.9 33.1 37.5 43.0 49.4Nor<strong>the</strong>rn Mariana Islands 39 62 81 96 111 89.7 90.2 91.3 92.4 93.3Palau 10 13 17 20 23 69.6 70.0 83.4 89.6 92.0Papua New Guinea 619 711 863 1,194 1,828 15.0 13.2 12.5 14.1 18.2Pitcairn — — — — — — — — — —Samoa 34 39 36 38 46 21.2 22.0 20.2 20.5 24.0Solomon Islands 43 65 99 152 230 13.7 15.7 18.6 23.0 29.2Tokelau — — — — — — — — — —Tonga 21 23 24 28 35 22.7 23.0 23.4 25.6 30.4Tuvalu 4 4 5 6 7 40.7 46.0 50.4 55.6 61.5Vanuatu 28 41 63 95 140 18.7 21.7 25.6 31.0 38.0Wallis and Futuna Islands — — — — — — — — — —Source: <strong>United</strong> <strong>Nations</strong> Department <strong>of</strong> Economic and Social Affairs, Population Division (2010) World Urbanization Prospects: The 2009 Revision, <strong>United</strong> <strong>Nations</strong>, New York.149