

STATISTICS
LMTHw
LMTHw

You also want an ePaper? Increase the reach of your titles
YUMPU automatically turns print PDFs into web optimized ePapers that Google loves.
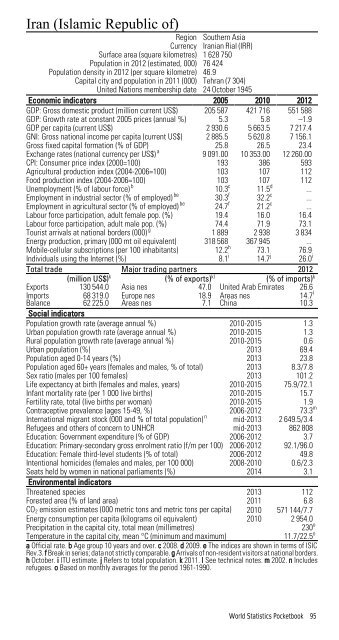
Iran (Islamic Republic of)<br />
Region Southern Asia<br />
Currency Iranian Rial (IRR)<br />
Surface area (square kilometres) 1 628 750<br />
Population in 2012 (estimated, 000) 76 424<br />
Population density in 2012 (per square kilometre) 46.9<br />
Capital city and population in 2011 (000) Tehran (7 304)<br />
United Nations membership date 24 October 1945<br />
Economic indicators 2005 2010 2012<br />
GDP: Gross domestic product (million current US$) 205 587 421 716 551 588<br />
GDP: Growth rate at constant 2005 prices (annual %) 5.3 5.8 –1.9<br />
GDP per capita (current US$) 2 930.6 5 663.5 7 217.4<br />
GNI: Gross national income per capita (current US$) 2 885.5 5 620.8 7 156.1<br />
Gross fixed capital formation (% of GDP) 25.8 26.5 23.4<br />
Exchange rates (national currency per US$) a 9 091.00 10 353.00 12 260.00<br />
CPI: Consumer price index (2000=100) 193 386 593<br />
Agricultural production index (2004-2006=100) 103 107 112<br />
Food production index (2004-2006=100) 103 107 112<br />
Unemployment (% of labour force) b 10.3 c 11.5 d ...<br />
Employment in industrial sector (% of employed) be 30.3 f 32.2 c ...<br />
Employment in agricultural sector (% of employed) be 24.7 f 21.2 c ...<br />
Labour force participation, adult female pop. (%) 19.4 16.0 16.4<br />
Labour force participation, adult male pop. (%) 74.4 71.9 73.1<br />
Tourist arrivals at national borders (000) g 1 889 2 938 3 834<br />
Energy production, primary (000 mt oil equivalent) 318 568 367 945 ...<br />
Mobile-cellular subscriptions (per 100 inhabitants) 12.2 h 73.1 76.9<br />
Individuals using the Internet (%) 8.1 i 14.7 j 26.0 i<br />
Total trade Major trading partners 2012<br />
(million US$) k (% of exports) kl (% of imports) k<br />
Exports 130 544.0 Asia nes 47.0 United Arab Emirates 26.6<br />
Imports<br />
Balance<br />
68 319.0<br />
62 225.0<br />
Europe nes<br />
Areas nes<br />
18.9<br />
7.1<br />
Areas nes<br />
China<br />
14.7 l<br />
10.3<br />
Social indicators<br />
Population growth rate (average annual %) 2010-2015 1.3<br />
Urban population growth rate (average annual %) 2010-2015 1.3<br />
Rural population growth rate (average annual %) 2010-2015 0.6<br />
Urban population (%) 2013 69.4<br />
Population aged 0-14 years (%) 2013 23.8<br />
Population aged 60+ years (females and males, % of total) 2013 8.3/7.8<br />
Sex ratio (males per 100 females) 2013 101.2<br />
Life expectancy at birth (females and males, years) 2010-2015 75.9/72.1<br />
Infant mortality rate (per 1 000 live births) 2010-2015 15.7<br />
Fertility rate, total (live births per woman) 2010-2015 1.9<br />
Contraceptive prevalence (ages 15-49, %) 2006-2012 73.3 m<br />
International migrant stock (000 and % of total population) n mid-2013 2 649.5/3.4<br />
Refugees and others of concern to UNHCR mid-2013 862 808<br />
Education: Government expenditure (% of GDP) 2006-2012 3.7<br />
Education: Primary-secondary gross enrolment ratio (f/m per 100) 2006-2012 92.1/96.0<br />
Education: Female third-level students (% of total) 2006-2012 49.8<br />
Intentional homicides (females and males, per 100 000) 2008-2010 0.6/2.3<br />
Seats held by women in national parliaments (%) 2014 3.1<br />
Environmental indicators<br />
Threatened species 2013 112<br />
Forested area (% of land area) 2011 6.8<br />
CO 2 emission estimates (000 metric tons and metric tons per capita) 2010 571 144/7.7<br />
Energy consumption per capita (kilograms oil equivalent) 2010 2 954.0<br />
Precipitation in the capital city, total mean (millimetres)<br />
230 o<br />
Temperature in the capital city, mean °C (minimum and maximum)<br />
11.7/22.5 o<br />
a Official rate. b Age group 10 years and over. c 2008. d 2009. e The indices are shown in terms of ISIC<br />
Rev.3. f Break in series; data not strictly comparable. g Arrivals of non-resident visitors at national borders.<br />
h October. i ITU estimate. j Refers to total population. k 2011. l See technical notes. m 2002. n Includes<br />
refugees. o Based on monthly averages for the period 1961-1990.<br />
World Statistics Pocketbook 95