

STATISTICS
LMTHw
LMTHw

You also want an ePaper? Increase the reach of your titles
YUMPU automatically turns print PDFs into web optimized ePapers that Google loves.
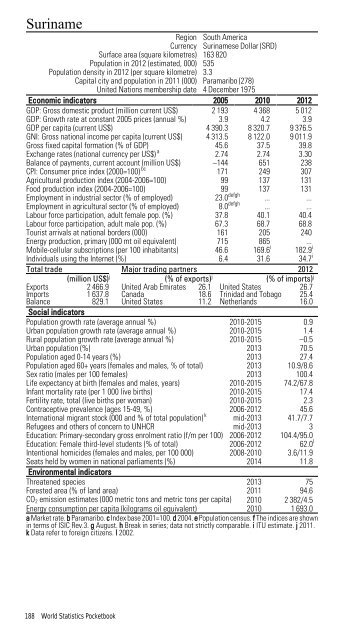
Suriname<br />
Region South America<br />
Currency Surinamese Dollar (SRD)<br />
Surface area (square kilometres) 163 820<br />
Population in 2012 (estimated, 000) 535<br />
Population density in 2012 (per square kilometre) 3.3<br />
Capital city and population in 2011 (000) Paramaribo (278)<br />
United Nations membership date 4 December 1975<br />
Economic indicators 2005 2010 2012<br />
GDP: Gross domestic product (million current US$) 2 193 4 368 5 012<br />
GDP: Growth rate at constant 2005 prices (annual %) 3.9 4.2 3.9<br />
GDP per capita (current US$) 4 390.3 8 320.7 9 376.5<br />
GNI: Gross national income per capita (current US$) 4 313.5 8 122.0 9 011.9<br />
Gross fixed capital formation (% of GDP) 45.6 37.5 39.8<br />
Exchange rates (national currency per US$) a 2.74 2.74 3.30<br />
Balance of payments, current account (million US$) –144 651 238<br />
CPI: Consumer price index (2000=100) bc 171 249 307<br />
Agricultural production index (2004-2006=100) 99 137 131<br />
Food production index (2004-2006=100) 99 137 131<br />
Employment in industrial sector (% of employed) 23.0 defgh ... ...<br />
Employment in agricultural sector (% of employed) 8.0 defgh ... ...<br />
Labour force participation, adult female pop. (%) 37.8 40.1 40.4<br />
Labour force participation, adult male pop. (%) 67.3 68.7 68.8<br />
Tourist arrivals at national borders (000) 161 205 240<br />
Energy production, primary (000 mt oil equivalent) 715 865 ...<br />
Mobile-cellular subscriptions (per 100 inhabitants) 46.6 169.6 i 182.9 i<br />
Individuals using the Internet (%) 6.4 31.6 34.7 i<br />
Total trade Major trading partners 2012<br />
(million US$) j (% of exports) j (% of imports) j<br />
Exports 2 466.9 United Arab Emirates 26.1 United States 26.7<br />
Imports 1 637.8 Canada 18.6 Trinidad and Tobago 25.4<br />
Balance 829.1 United States 11.2 Netherlands 16.0<br />
Social indicators<br />
Population growth rate (average annual %) 2010-2015 0.9<br />
Urban population growth rate (average annual %) 2010-2015 1.4<br />
Rural population growth rate (average annual %) 2010-2015 –0.5<br />
Urban population (%) 2013 70.5<br />
Population aged 0-14 years (%) 2013 27.4<br />
Population aged 60+ years (females and males, % of total) 2013 10.9/8.6<br />
Sex ratio (males per 100 females) 2013 100.4<br />
Life expectancy at birth (females and males, years) 2010-2015 74.2/67.8<br />
Infant mortality rate (per 1 000 live births) 2010-2015 17.4<br />
Fertility rate, total (live births per woman) 2010-2015 2.3<br />
Contraceptive prevalence (ages 15-49, %) 2006-2012 45.6<br />
International migrant stock (000 and % of total population) k mid-2013 41.7/7.7<br />
Refugees and others of concern to UNHCR mid-2013 3<br />
Education: Primary-secondary gross enrolment ratio (f/m per 100) 2006-2012 104.4/95.0<br />
Education: Female third-level students (% of total) 2006-2012 62.0 l<br />
Intentional homicides (females and males, per 100 000) 2008-2010 3.6/11.9<br />
Seats held by women in national parliaments (%) 2014 11.8<br />
Environmental indicators<br />
Threatened species 2013 75<br />
Forested area (% of land area) 2011 94.6<br />
CO 2 emission estimates (000 metric tons and metric tons per capita) 2010 2 382/4.5<br />
Energy consumption per capita (kilograms oil equivalent) 2010 1 693.0<br />
a Market rate. b Paramaribo. c Index base 2001=100. d 2004. e Population census. f The indices are shown<br />
in terms of ISIC Rev.3. g August. h Break in series; data not strictly comparable. i ITU estimate. j 2011.<br />
k Data refer to foreign citizens. l 2002.<br />
188 World Statistics Pocketbook