

STATISTICS
LMTHw
LMTHw

Create successful ePaper yourself
Turn your PDF publications into a flip-book with our unique Google optimized e-Paper software.
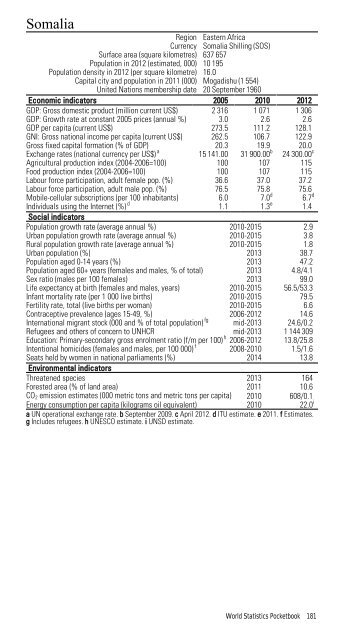
Somalia<br />
Region Eastern Africa<br />
Currency Somalia Shilling (SOS)<br />
Surface area (square kilometres) 637 657<br />
Population in 2012 (estimated, 000) 10 195<br />
Population density in 2012 (per square kilometre) 16.0<br />
Capital city and population in 2011 (000) Mogadishu (1 554)<br />
United Nations membership date 20 September 1960<br />
Economic indicators 2005 2010 2012<br />
GDP: Gross domestic product (million current US$) 2 316 1 071 1 306<br />
GDP: Growth rate at constant 2005 prices (annual %) 3.0 2.6 2.6<br />
GDP per capita (current US$) 273.5 111.2 128.1<br />
GNI: Gross national income per capita (current US$) 262.5 106.7 122.9<br />
Gross fixed capital formation (% of GDP) 20.3 19.9 20.0<br />
Exchange rates (national currency per US$) a 15 141.00 31 900.00 b 24 300.00 c<br />
Agricultural production index (2004-2006=100) 100 107 115<br />
Food production index (2004-2006=100) 100 107 115<br />
Labour force participation, adult female pop. (%) 36.6 37.0 37.2<br />
Labour force participation, adult male pop. (%) 76.5 75.8 75.6<br />
Mobile-cellular subscriptions (per 100 inhabitants) 6.0 7.0 d 6.7 d<br />
Individuals using the Internet (%) d 1.1 1.3 e 1.4<br />
Social indicators<br />
Population growth rate (average annual %) 2010-2015 2.9<br />
Urban population growth rate (average annual %) 2010-2015 3.8<br />
Rural population growth rate (average annual %) 2010-2015 1.8<br />
Urban population (%) 2013 38.7<br />
Population aged 0-14 years (%) 2013 47.2<br />
Population aged 60+ years (females and males, % of total) 2013 4.8/4.1<br />
Sex ratio (males per 100 females) 2013 99.0<br />
Life expectancy at birth (females and males, years) 2010-2015 56.5/53.3<br />
Infant mortality rate (per 1 000 live births) 2010-2015 79.5<br />
Fertility rate, total (live births per woman) 2010-2015 6.6<br />
Contraceptive prevalence (ages 15-49, %) 2006-2012 14.6<br />
International migrant stock (000 and % of total population) fg mid-2013 24.6/0.2<br />
Refugees and others of concern to UNHCR mid-2013 1 144 309<br />
Education: Primary-secondary gross enrolment ratio (f/m per 100) h 2006-2012 13.8/25.8<br />
Intentional homicides (females and males, per 100 000) f 2008-2010 1.5/1.6<br />
Seats held by women in national parliaments (%) 2014 13.8<br />
Environmental indicators<br />
Threatened species 2013 164<br />
Forested area (% of land area) 2011 10.6<br />
CO 2 emission estimates (000 metric tons and metric tons per capita) 2010 608/0.1<br />
Energy consumption per capita (kilograms oil equivalent) 2010 22.0 i<br />
a UN operational exchange rate. b September 2009. c April 2012. d ITU estimate. e 2011. f Estimates.<br />
g Includes refugees. h UNESCO estimate. i UNSD estimate.<br />
World Statistics Pocketbook 181