

STATISTICS
LMTHw
LMTHw

Create successful ePaper yourself
Turn your PDF publications into a flip-book with our unique Google optimized e-Paper software.
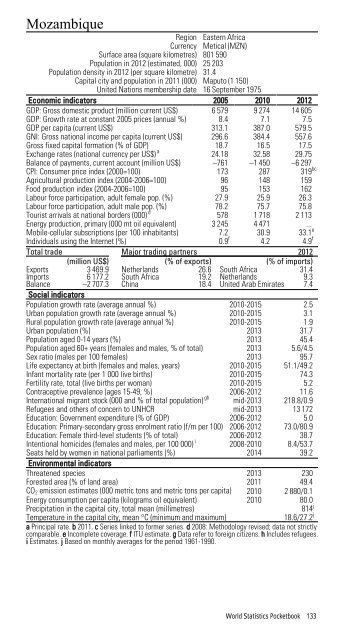
Mozambique<br />
Region Eastern Africa<br />
Currency Metical (MZN)<br />
Surface area (square kilometres) 801 590<br />
Population in 2012 (estimated, 000) 25 203<br />
Population density in 2012 (per square kilometre) 31.4<br />
Capital city and population in 2011 (000) Maputo (1 150)<br />
United Nations membership date 16 September 1975<br />
Economic indicators 2005 2010 2012<br />
GDP: Gross domestic product (million current US$) 6 579 9 274 14 605<br />
GDP: Growth rate at constant 2005 prices (annual %) 8.4 7.1 7.5<br />
GDP per capita (current US$) 313.1 387.0 579.5<br />
GNI: Gross national income per capita (current US$) 296.6 384.4 557.6<br />
Gross fixed capital formation (% of GDP) 18.7 16.5 17.5<br />
Exchange rates (national currency per US$) a 24.18 32.58 29.75<br />
Balance of payments, current account (million US$) –761 –1 450 –6 297<br />
CPI: Consumer price index (2000=100) 173 287 319 bc<br />
Agricultural production index (2004-2006=100) 96 148 159<br />
Food production index (2004-2006=100) 95 153 162<br />
Labour force participation, adult female pop. (%) 27.9 25.9 26.3<br />
Labour force participation, adult male pop. (%) 78.2 75.7 75.8<br />
Tourist arrivals at national borders (000) d 578 1 718 2 113<br />
Energy production, primary (000 mt oil equivalent) 3 245 4 471 ...<br />
Mobile-cellular subscriptions (per 100 inhabitants) 7.2 30.9 33.1 e<br />
Individuals using the Internet (%) 0.9 f 4.2 4.9 f<br />
Total trade Major trading partners 2012<br />
(million US$) (% of exports) (% of imports)<br />
Exports 3 469.9 Netherlands 26.6 South Africa 31.4<br />
Imports 6 177.2 South Africa 19.2 Netherlands 9.3<br />
Balance –2 707.3 China 18.4 United Arab Emirates 7.4<br />
Social indicators<br />
Population growth rate (average annual %) 2010-2015 2.5<br />
Urban population growth rate (average annual %) 2010-2015 3.1<br />
Rural population growth rate (average annual %) 2010-2015 1.9<br />
Urban population (%) 2013 31.7<br />
Population aged 0-14 years (%) 2013 45.4<br />
Population aged 60+ years (females and males, % of total) 2013 5.6/4.5<br />
Sex ratio (males per 100 females) 2013 95.7<br />
Life expectancy at birth (females and males, years) 2010-2015 51.1/49.2<br />
Infant mortality rate (per 1 000 live births) 2010-2015 74.3<br />
Fertility rate, total (live births per woman) 2010-2015 5.2<br />
Contraceptive prevalence (ages 15-49, %) 2006-2012 11.6<br />
International migrant stock (000 and % of total population) gh mid-2013 218.8/0.9<br />
Refugees and others of concern to UNHCR mid-2013 13 172<br />
Education: Government expenditure (% of GDP) 2006-2012 5.0<br />
Education: Primary-secondary gross enrolment ratio (f/m per 100) 2006-2012 73.0/80.9<br />
Education: Female third-level students (% of total) 2006-2012 38.7<br />
Intentional homicides (females and males, per 100 000) i 2008-2010 8.4/53.7<br />
Seats held by women in national parliaments (%) 2014 39.2<br />
Environmental indicators<br />
Threatened species 2013 230<br />
Forested area (% of land area) 2011 49.4<br />
CO 2 emission estimates (000 metric tons and metric tons per capita) 2010 2 880/0.1<br />
Energy consumption per capita (kilograms oil equivalent) 2010 80.0<br />
Precipitation in the capital city, total mean (millimetres)<br />
814 j<br />
Temperature in the capital city, mean °C (minimum and maximum)<br />
18.6/27.2 j<br />
a Principal rate. b 2011. c Series linked to former series. d 2008: Methodology revised; data not strictly<br />
comparable. e Incomplete coverage. f ITU estimate. g Data refer to foreign citizens. h Includes refugees.<br />
i Estimates. j Based on monthly averages for the period 1961-1990.<br />
World Statistics Pocketbook 133