

STATISTICS
LMTHw
LMTHw

You also want an ePaper? Increase the reach of your titles
YUMPU automatically turns print PDFs into web optimized ePapers that Google loves.
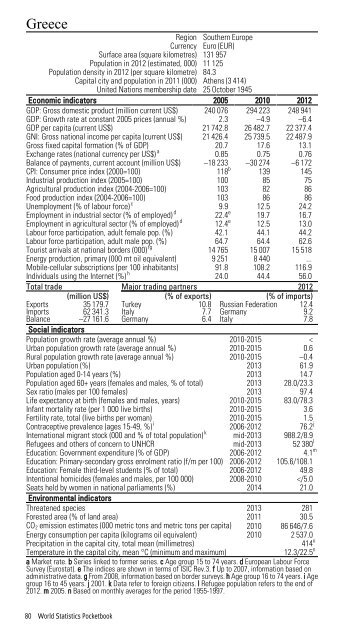
Greece<br />
Region Southern Europe<br />
Currency Euro (EUR)<br />
Surface area (square kilometres) 131 957<br />
Population in 2012 (estimated, 000) 11 125<br />
Population density in 2012 (per square kilometre) 84.3<br />
Capital city and population in 2011 (000) Athens (3 414)<br />
United Nations membership date 25 October 1945<br />
Economic indicators 2005 2010 2012<br />
GDP: Gross domestic product (million current US$) 240 076 294 223 248 941<br />
GDP: Growth rate at constant 2005 prices (annual %) 2.3 –4.9 –6.4<br />
GDP per capita (current US$) 21 742.8 26 482.7 22 377.4<br />
GNI: Gross national income per capita (current US$) 21 426.4 25 739.5 22 487.9<br />
Gross fixed capital formation (% of GDP) 20.7 17.6 13.1<br />
Exchange rates (national currency per US$) a 0.85 0.75 0.76<br />
Balance of payments, current account (million US$) –18 233 –30 274 –6 172<br />
CPI: Consumer price index (2000=100) 118 b 139 145<br />
Industrial production index (2005=100) 100 85 75<br />
Agricultural production index (2004-2006=100) 103 82 86<br />
Food production index (2004-2006=100) 103 86 86<br />
Unemployment (% of labour force) c 9.9 12.5 24.2<br />
Employment in industrial sector (% of employed) d 22.4 e 19.7 16.7<br />
Employment in agricultural sector (% of employed) d 12.4 e 12.5 13.0<br />
Labour force participation, adult female pop. (%) 42.1 44.1 44.2<br />
Labour force participation, adult male pop. (%) 64.7 64.4 62.6<br />
Tourist arrivals at national borders (000) fg 14 765 15 007 15 518<br />
Energy production, primary (000 mt oil equivalent) 9 251 8 440 ...<br />
Mobile-cellular subscriptions (per 100 inhabitants) 91.8 108.2 116.9<br />
Individuals using the Internet (%) h 24.0 44.4 56.0<br />
Total trade Major trading partners 2012<br />
(million US$) (% of exports) (% of imports)<br />
Exports 35 179.7 Turkey 10.8 Russian Federation 12.4<br />
Imports 62 341.3 Italy 7.7 Germany 9.2<br />
Balance –27 161.6 Germany 6.4 Italy 7.8<br />
Social indicators<br />
Population growth rate (average annual %) 2010-2015 <<br />
Urban population growth rate (average annual %) 2010-2015 0.6<br />
Rural population growth rate (average annual %) 2010-2015 –0.4<br />
Urban population (%) 2013 61.9<br />
Population aged 0-14 years (%) 2013 14.7<br />
Population aged 60+ years (females and males, % of total) 2013 28.0/23.3<br />
Sex ratio (males per 100 females) 2013 97.4<br />
Life expectancy at birth (females and males, years) 2010-2015 83.0/78.3<br />
Infant mortality rate (per 1 000 live births) 2010-2015 3.6<br />
Fertility rate, total (live births per woman) 2010-2015 1.5<br />
Contraceptive prevalence (ages 15-49, %) i 2006-2012 76.2 j<br />
International migrant stock (000 and % of total population) k mid-2013 988.2/8.9<br />
Refugees and others of concern to UNHCR mid-2013 52 380 l<br />
Education: Government expenditure (% of GDP) 2006-2012 4.1 m<br />
Education: Primary-secondary gross enrolment ratio (f/m per 100) 2006-2012 105.6/108.1<br />
Education: Female third-level students (% of total) 2006-2012 49.8<br />
Intentional homicides (females and males, per 100 000) 2008-2010