

STATISTICS
LMTHw
LMTHw

Create successful ePaper yourself
Turn your PDF publications into a flip-book with our unique Google optimized e-Paper software.
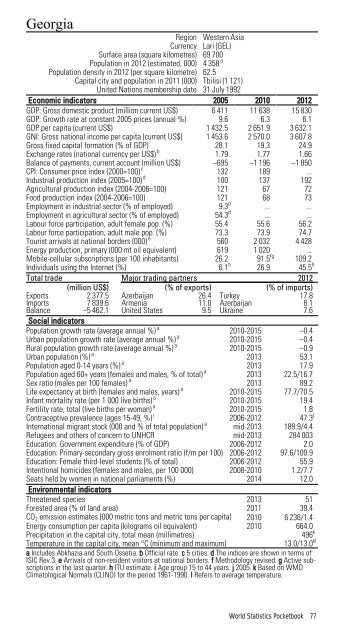
Georgia<br />
Region Western Asia<br />
Currency Lari (GEL)<br />
Surface area (square kilometres) 69 700<br />
Population in 2012 (estimated, 000) 4 358 a<br />
Population density in 2012 (per square kilometre) 62.5<br />
Capital city and population in 2011 (000) Tbilisi (1 121)<br />
United Nations membership date 31 July 1992<br />
Economic indicators 2005 2010 2012<br />
GDP: Gross domestic product (million current US$) 6 411 11 638 15 830<br />
GDP: Growth rate at constant 2005 prices (annual %) 9.6 6.3 6.1<br />
GDP per capita (current US$) 1 432.5 2 651.9 3 632.1<br />
GNI: Gross national income per capita (current US$) 1 453.6 2 570.0 3 607.8<br />
Gross fixed capital formation (% of GDP) 28.1 19.3 24.9<br />
Exchange rates (national currency per US$) b 1.79 1.77 1.66<br />
Balance of payments, current account (million US$) –695 –1 196 –1 850<br />
CPI: Consumer price index (2000=100) c 132 189 ...<br />
Industrial production index (2005=100) d 100 137 192<br />
Agricultural production index (2004-2006=100) 121 67 72<br />
Food production index (2004-2006=100) 121 68 73<br />
Employment in industrial sector (% of employed) 9.3 d ... ...<br />
Employment in agricultural sector (% of employed) 54.3 d ... ...<br />
Labour force participation, adult female pop. (%) 55.4 55.6 56.2<br />
Labour force participation, adult male pop. (%) 73.3 73.9 74.7<br />
Tourist arrivals at national borders (000) e 560 2 032 4 428<br />
Energy production, primary (000 mt oil equivalent) 619 1 020 ...<br />
Mobile-cellular subscriptions (per 100 inhabitants) 26.2 91.5 fg 109.2<br />
Individuals using the Internet (%) 6.1 h 26.9 45.5 h<br />
Total trade Major trading partners 2012<br />
(million US$) (% of exports) (% of imports)<br />
Exports 2 377.5 Azerbaijan 26.4 Turkey 17.8<br />
Imports 7 839.6 Armenia 11.0 Azerbaijan 8.1<br />
Balance –5 462.1 United States 9.5 Ukraine 7.6<br />
Social indicators<br />
Population growth rate (average annual %) a 2010-2015 –0.4<br />
Urban population growth rate (average annual %) a 2010-2015 –0.4<br />
Rural population growth rate (average annual %) a 2010-2015 –0.9<br />
Urban population (%) a 2013 53.1<br />
Population aged 0-14 years (%) a 2013 17.9<br />
Population aged 60+ years (females and males, % of total) a 2013 22.5/16.7<br />
Sex ratio (males per 100 females) a 2013 89.2<br />
Life expectancy at birth (females and males, years) a 2010-2015 77.7/70.5<br />
Infant mortality rate (per 1 000 live births) a 2010-2015 19.4<br />
Fertility rate, total (live births per woman) a 2010-2015 1.8<br />
Contraceptive prevalence (ages 15-49, %) i 2006-2012 47.3 j<br />
International migrant stock (000 and % of total population) a mid-2013 189.9/4.4<br />
Refugees and others of concern to UNHCR mid-2013 284 003<br />
Education: Government expenditure (% of GDP) 2006-2012 2.0<br />
Education: Primary-secondary gross enrolment ratio (f/m per 100) 2006-2012 97.6/100.9<br />
Education: Female third-level students (% of total) 2006-2012 55.9<br />
Intentional homicides (females and males, per 100 000) 2008-2010 1.2/7.7<br />
Seats held by women in national parliaments (%) 2014 12.0<br />
Environmental indicators<br />
Threatened species 2013 51<br />
Forested area (% of land area) 2011 39.4<br />
CO 2 emission estimates (000 metric tons and metric tons per capita) 2010 6 236/1.4<br />
Energy consumption per capita (kilograms oil equivalent) 2010 664.0<br />
Precipitation in the capital city, total mean (millimetres)<br />
496 k<br />
Temperature in the capital city, mean °C (minimum and maximum)<br />
13.0/13.0 kl<br />
a Includes Abkhazia and South Ossetia. b Official rate. c 5 cities. d The indices are shown in terms of<br />
ISIC Rev.3. e Arrivals of non-resident visitors at national borders. f Methodology revised. g Active subscriptions<br />
in the last quarter. h ITU estimate. i Age group 15 to 44 years. j 2005. k Based on WMO<br />
Climatological Normals (CLINO) for the period 1961-1990. l Refers to average temperature.<br />
World Statistics Pocketbook 77