

STATISTICS
LMTHw
LMTHw

You also want an ePaper? Increase the reach of your titles
YUMPU automatically turns print PDFs into web optimized ePapers that Google loves.
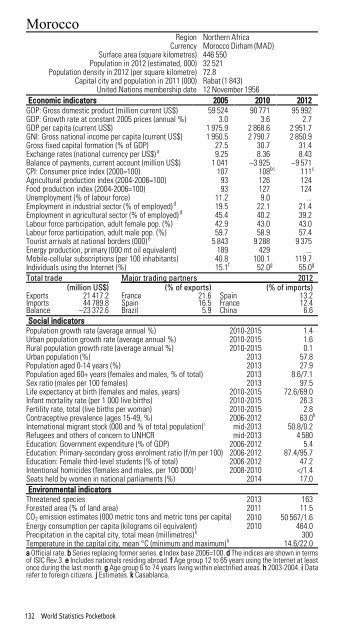
Morocco<br />
Region Northern Africa<br />
Currency Morocco Dirham (MAD)<br />
Surface area (square kilometres) 446 550<br />
Population in 2012 (estimated, 000) 32 521<br />
Population density in 2012 (per square kilometre) 72.8<br />
Capital city and population in 2011 (000) Rabat (1 843)<br />
United Nations membership date 12 November 1956<br />
Economic indicators 2005 2010 2012<br />
GDP: Gross domestic product (million current US$) 59 524 90 771 95 992<br />
GDP: Growth rate at constant 2005 prices (annual %) 3.0 3.6 2.7<br />
GDP per capita (current US$) 1 975.9 2 868.6 2 951.7<br />
GNI: Gross national income per capita (current US$) 1 950.5 2 790.7 2 850.9<br />
Gross fixed capital formation (% of GDP) 27.5 30.7 31.4<br />
Exchange rates (national currency per US$) a 9.25 8.36 8.43<br />
Balance of payments, current account (million US$) 1 041 –3 925 –9 571<br />
CPI: Consumer price index (2000=100) 107 108 bc 111 c<br />
Agricultural production index (2004-2006=100) 93 126 124<br />
Food production index (2004-2006=100) 93 127 124<br />
Unemployment (% of labour force) 11.2 9.0 ...<br />
Employment in industrial sector (% of employed) d 19.5 22.1 21.4<br />
Employment in agricultural sector (% of employed) d 45.4 40.2 39.2<br />
Labour force participation, adult female pop. (%) 42.9 43.0 43.0<br />
Labour force participation, adult male pop. (%) 59.7 58.9 57.4<br />
Tourist arrivals at national borders (000) e 5 843 9 288 9 375<br />
Energy production, primary (000 mt oil equivalent) 189 429 ...<br />
Mobile-cellular subscriptions (per 100 inhabitants) 40.8 100.1 119.7<br />
Individuals using the Internet (%) 15.1 f 52.0 g 55.0 g<br />
Total trade Major trading partners 2012<br />
(million US$) (% of exports) (% of imports)<br />
Exports 21 417.2 France 21.6 Spain 13.2<br />
Imports 44 789.8 Spain 16.5 France 12.4<br />
Balance –23 372.6 Brazil 5.9 China 6.6<br />
Social indicators<br />
Population growth rate (average annual %) 2010-2015 1.4<br />
Urban population growth rate (average annual %) 2010-2015 1.6<br />
Rural population growth rate (average annual %) 2010-2015 0.1<br />
Urban population (%) 2013 57.8<br />
Population aged 0-14 years (%) 2013 27.9<br />
Population aged 60+ years (females and males, % of total) 2013 8.6/7.1<br />
Sex ratio (males per 100 females) 2013 97.5<br />
Life expectancy at birth (females and males, years) 2010-2015 72.6/69.0<br />
Infant mortality rate (per 1 000 live births) 2010-2015 26.3<br />
Fertility rate, total (live births per woman) 2010-2015 2.8<br />
Contraceptive prevalence (ages 15-49, %) 2006-2012 63.0 h<br />
International migrant stock (000 and % of total population) i mid-2013 50.8/0.2<br />
Refugees and others of concern to UNHCR mid-2013 4 580<br />
Education: Government expenditure (% of GDP) 2006-2012 5.4<br />
Education: Primary-secondary gross enrolment ratio (f/m per 100) 2006-2012 87.4/95.7<br />
Education: Female third-level students (% of total) 2006-2012 47.2<br />
Intentional homicides (females and males, per 100 000) j 2008-2010