

STATISTICS
LMTHw
LMTHw

You also want an ePaper? Increase the reach of your titles
YUMPU automatically turns print PDFs into web optimized ePapers that Google loves.
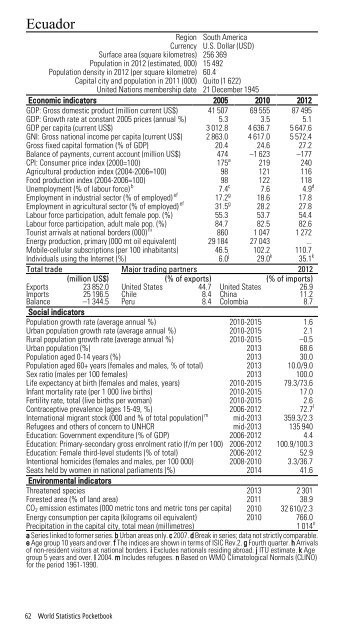
Ecuador<br />
Region South America<br />
Currency U.S. Dollar (USD)<br />
Surface area (square kilometres) 256 369<br />
Population in 2012 (estimated, 000) 15 492<br />
Population density in 2012 (per square kilometre) 60.4<br />
Capital city and population in 2011 (000) Quito (1 622)<br />
United Nations membership date 21 December 1945<br />
Economic indicators 2005 2010 2012<br />
GDP: Gross domestic product (million current US$) 41 507 69 555 87 495<br />
GDP: Growth rate at constant 2005 prices (annual %) 5.3 3.5 5.1<br />
GDP per capita (current US$) 3 012.8 4 636.7 5 647.6<br />
GNI: Gross national income per capita (current US$) 2 863.0 4 617.0 5 572.4<br />
Gross fixed capital formation (% of GDP) 20.4 24.6 27.2<br />
Balance of payments, current account (million US$) 474 –1 623 –177<br />
CPI: Consumer price index (2000=100) 175 a 219 240<br />
Agricultural production index (2004-2006=100) 98 121 116<br />
Food production index (2004-2006=100) 98 122 118<br />
Unemployment (% of labour force) b 7.4 c 7.6 4.9 d<br />
Employment in industrial sector (% of employed) ef 17.2 g 18.6 17.8<br />
Employment in agricultural sector (% of employed) ef 31.5 g 28.2 27.8<br />
Labour force participation, adult female pop. (%) 55.3 53.7 54.4<br />
Labour force participation, adult male pop. (%) 84.7 82.5 82.6<br />
Tourist arrivals at national borders (000) hi 860 1 047 1 272<br />
Energy production, primary (000 mt oil equivalent) 29 184 27 043 ...<br />
Mobile-cellular subscriptions (per 100 inhabitants) 46.5 102.2 110.7<br />
Individuals using the Internet (%) 6.0 j 29.0 k 35.1 k<br />
Total trade Major trading partners 2012<br />
(million US$) (% of exports) (% of imports)<br />
Exports 23 852.0 United States 44.7 United States 26.9<br />
Imports 25 196.5 Chile 8.4 China 11.2<br />
Balance –1 344.5 Peru 8.4 Colombia 8.7<br />
Social indicators<br />
Population growth rate (average annual %) 2010-2015 1.6<br />
Urban population growth rate (average annual %) 2010-2015 2.1<br />
Rural population growth rate (average annual %) 2010-2015 –0.5<br />
Urban population (%) 2013 68.6<br />
Population aged 0-14 years (%) 2013 30.0<br />
Population aged 60+ years (females and males, % of total) 2013 10.0/9.0<br />
Sex ratio (males per 100 females) 2013 100.0<br />
Life expectancy at birth (females and males, years) 2010-2015 79.3/73.6<br />
Infant mortality rate (per 1 000 live births) 2010-2015 17.0<br />
Fertility rate, total (live births per woman) 2010-2015 2.6<br />
Contraceptive prevalence (ages 15-49, %) 2006-2012 72.7 l<br />
International migrant stock (000 and % of total population) m mid-2013 359.3/2.3<br />
Refugees and others of concern to UNHCR mid-2013 135 940<br />
Education: Government expenditure (% of GDP) 2006-2012 4.4<br />
Education: Primary-secondary gross enrolment ratio (f/m per 100) 2006-2012 100.9/100.3<br />
Education: Female third-level students (% of total) 2006-2012 52.9<br />
Intentional homicides (females and males, per 100 000) 2008-2010 3.3/36.7<br />
Seats held by women in national parliaments (%) 2014 41.6<br />
Environmental indicators<br />
Threatened species 2013 2 301<br />
Forested area (% of land area) 2011 38.9<br />
CO 2 emission estimates (000 metric tons and metric tons per capita) 2010 32 610/2.3<br />
Energy consumption per capita (kilograms oil equivalent) 2010 766.0<br />
Precipitation in the capital city, total mean (millimetres)<br />
1 014 n<br />
a Series linked to former series. b Urban areas only. c 2007. d Break in series; data not strictly comparable.<br />
e Age group 10 years and over. f The indices are shown in terms of ISIC Rev.2. g Fourth quarter. h Arrivals<br />
of non-resident visitors at national borders. i Excludes nationals residing abroad. j ITU estimate. k Age<br />
group 5 years and over. l 2004. m Includes refugees. n Based on WMO Climatological Normals (CLINO)<br />
for the period 1961-1990.<br />
62 World Statistics Pocketbook