

STATISTICS
LMTHw
LMTHw

You also want an ePaper? Increase the reach of your titles
YUMPU automatically turns print PDFs into web optimized ePapers that Google loves.
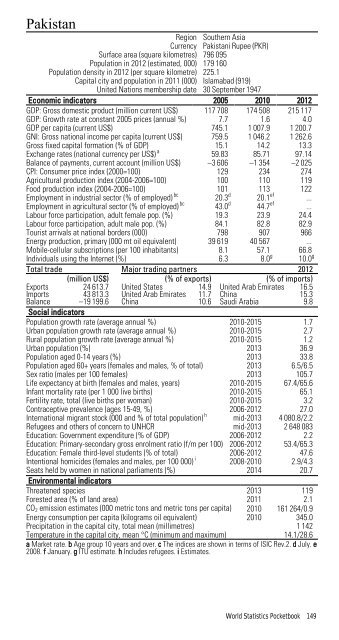
Pakistan<br />
Region Southern Asia<br />
Currency Pakistani Rupee (PKR)<br />
Surface area (square kilometres) 796 095<br />
Population in 2012 (estimated, 000) 179 160<br />
Population density in 2012 (per square kilometre) 225.1<br />
Capital city and population in 2011 (000) Islamabad (919)<br />
United Nations membership date 30 September 1947<br />
Economic indicators 2005 2010 2012<br />
GDP: Gross domestic product (million current US$) 117 708 174 508 215 117<br />
GDP: Growth rate at constant 2005 prices (annual %) 7.7 1.6 4.0<br />
GDP per capita (current US$) 745.1 1 007.9 1 200.7<br />
GNI: Gross national income per capita (current US$) 759.5 1 046.2 1 262.6<br />
Gross fixed capital formation (% of GDP) 15.1 14.2 13.3<br />
Exchange rates (national currency per US$) a 59.83 85.71 97.14<br />
Balance of payments, current account (million US$) –3 606 –1 354 –2 025<br />
CPI: Consumer price index (2000=100) 129 234 274<br />
Agricultural production index (2004-2006=100) 100 110 119<br />
Food production index (2004-2006=100) 101 113 122<br />
Employment in industrial sector (% of employed) bc 20.3 d 20.1 ef ...<br />
Employment in agricultural sector (% of employed) bc 43.0 d 44.7 ef ...<br />
Labour force participation, adult female pop. (%) 19.3 23.9 24.4<br />
Labour force participation, adult male pop. (%) 84.1 82.8 82.9<br />
Tourist arrivals at national borders (000) 798 907 966<br />
Energy production, primary (000 mt oil equivalent) 39 619 40 567 ...<br />
Mobile-cellular subscriptions (per 100 inhabitants) 8.1 57.1 66.8<br />
Individuals using the Internet (%) 6.3 8.0 g 10.0 g<br />
Total trade Major trading partners 2012<br />
(million US$) (% of exports) (% of imports)<br />
Exports 24 613.7 United States 14.9 United Arab Emirates 16.5<br />
Imports 43 813.3 United Arab Emirates 11.7 China 15.3<br />
Balance –19 199.6 China 10.6 Saudi Arabia 9.8<br />
Social indicators<br />
Population growth rate (average annual %) 2010-2015 1.7<br />
Urban population growth rate (average annual %) 2010-2015 2.7<br />
Rural population growth rate (average annual %) 2010-2015 1.2<br />
Urban population (%) 2013 36.9<br />
Population aged 0-14 years (%) 2013 33.8<br />
Population aged 60+ years (females and males, % of total) 2013 6.5/6.5<br />
Sex ratio (males per 100 females) 2013 105.7<br />
Life expectancy at birth (females and males, years) 2010-2015 67.4/65.6<br />
Infant mortality rate (per 1 000 live births) 2010-2015 65.1<br />
Fertility rate, total (live births per woman) 2010-2015 3.2<br />
Contraceptive prevalence (ages 15-49, %) 2006-2012 27.0<br />
International migrant stock (000 and % of total population) h mid-2013 4 080.8/2.2<br />
Refugees and others of concern to UNHCR mid-2013 2 648 083<br />
Education: Government expenditure (% of GDP) 2006-2012 2.2<br />
Education: Primary-secondary gross enrolment ratio (f/m per 100) 2006-2012 53.4/65.3<br />
Education: Female third-level students (% of total) 2006-2012 47.6<br />
Intentional homicides (females and males, per 100 000) i 2008-2010 2.9/4.3<br />
Seats held by women in national parliaments (%) 2014 20.7<br />
Environmental indicators<br />
Threatened species 2013 119<br />
Forested area (% of land area) 2011 2.1<br />
CO 2 emission estimates (000 metric tons and metric tons per capita) 2010 161 264/0.9<br />
Energy consumption per capita (kilograms oil equivalent) 2010 345.0<br />
Precipitation in the capital city, total mean (millimetres) 1 142<br />
Temperature in the capital city, mean °C (minimum and maximum) 14.1/28.6<br />
a Market rate. b Age group 10 years and over. c The indices are shown in terms of ISIC Rev.2. d July. e<br />
2008. f January. g ITU estimate. h Includes refugees. i Estimates.<br />
World Statistics Pocketbook 149