

STATISTICS
LMTHw
LMTHw

Create successful ePaper yourself
Turn your PDF publications into a flip-book with our unique Google optimized e-Paper software.
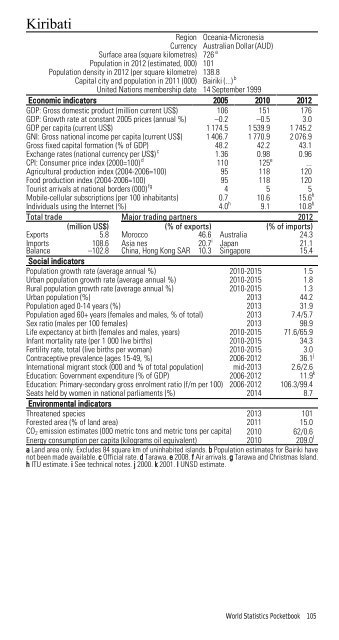
Kiribati<br />
Region Oceania-Micronesia<br />
Currency Australian Dollar (AUD)<br />
Surface area (square kilometres) 726 a<br />
Population in 2012 (estimated, 000) 101<br />
Population density in 2012 (per square kilometre) 138.8<br />
Capital city and population in 2011 (000) Bairiki (...) b<br />
United Nations membership date 14 September 1999<br />
Economic indicators 2005 2010 2012<br />
GDP: Gross domestic product (million current US$) 106 151 176<br />
GDP: Growth rate at constant 2005 prices (annual %) –0.2 –0.5 3.0<br />
GDP per capita (current US$) 1 174.5 1 539.9 1 745.2<br />
GNI: Gross national income per capita (current US$) 1 406.7 1 770.9 2 076.9<br />
Gross fixed capital formation (% of GDP) 48.2 42.2 43.1<br />
Exchange rates (national currency per US$) c 1.36 0.98 0.96<br />
CPI: Consumer price index (2000=100) d 110 125 e ...<br />
Agricultural production index (2004-2006=100) 95 118 120<br />
Food production index (2004-2006=100) 95 118 120<br />
Tourist arrivals at national borders (000) fg 4 5 5<br />
Mobile-cellular subscriptions (per 100 inhabitants) 0.7 10.6 15.6 h<br />
Individuals using the Internet (%) 4.0 h 9.1 10.8 h<br />
Total trade Major trading partners 2012<br />
(million US$) (% of exports) (% of imports)<br />
Exports 5.8 Morocco 46.6 Australia 24.3<br />
Imports<br />
Balance<br />
108.6<br />
–102.8<br />
Asia nes<br />
China, Hong Kong SAR<br />
20.7 i<br />
10.3<br />
Japan<br />
Singapore<br />
21.1<br />
15.4<br />
Social indicators<br />
Population growth rate (average annual %) 2010-2015 1.5<br />
Urban population growth rate (average annual %) 2010-2015 1.8<br />
Rural population growth rate (average annual %) 2010-2015 1.3<br />
Urban population (%) 2013 44.2<br />
Population aged 0-14 years (%) 2013 31.9<br />
Population aged 60+ years (females and males, % of total) 2013 7.4/5.7<br />
Sex ratio (males per 100 females) 2013 98.9<br />
Life expectancy at birth (females and males, years) 2010-2015 71.6/65.9<br />
Infant mortality rate (per 1 000 live births) 2010-2015 34.3<br />
Fertility rate, total (live births per woman) 2010-2015 3.0<br />
Contraceptive prevalence (ages 15-49, %) 2006-2012 36.1 j<br />
International migrant stock (000 and % of total population) mid-2013 2.6/2.6<br />
Education: Government expenditure (% of GDP) 2006-2012 11.9 k<br />
Education: Primary-secondary gross enrolment ratio (f/m per 100) 2006-2012 106.3/99.4<br />
Seats held by women in national parliaments (%) 2014 8.7<br />
Environmental indicators<br />
Threatened species 2013 101<br />
Forested area (% of land area) 2011 15.0<br />
CO 2 emission estimates (000 metric tons and metric tons per capita) 2010 62/0.6<br />
Energy consumption per capita (kilograms oil equivalent) 2010 209.0 l<br />
a Land area only. Excludes 84 square km of uninhabited islands. b Population estimates for Bairiki have<br />
not been made available. c Official rate. d Tarawa. e 2008. f Air arrivals. g Tarawa and Christmas Island.<br />
h ITU estimate. i See technical notes. j 2000. k 2001. l UNSD estimate.<br />
World Statistics Pocketbook 105