

STATISTICS
LMTHw
LMTHw

You also want an ePaper? Increase the reach of your titles
YUMPU automatically turns print PDFs into web optimized ePapers that Google loves.
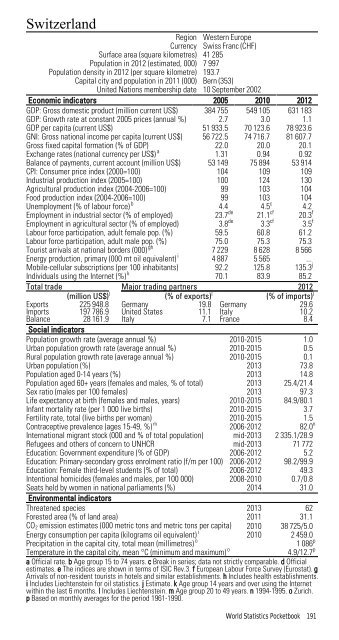
Switzerland<br />
Region Western Europe<br />
Currency Swiss Franc (CHF)<br />
Surface area (square kilometres) 41 285<br />
Population in 2012 (estimated, 000) 7 997<br />
Population density in 2012 (per square kilometre) 193.7<br />
Capital city and population in 2011 (000) Bern (353)<br />
United Nations membership date 10 September 2002<br />
Economic indicators 2005 2010 2012<br />
GDP: Gross domestic product (million current US$) 384 755 549 105 631 183<br />
GDP: Growth rate at constant 2005 prices (annual %) 2.7 3.0 1.1<br />
GDP per capita (current US$) 51 933.5 70 123.6 78 923.6<br />
GNI: Gross national income per capita (current US$) 56 722.5 74 716.7 81 607.7<br />
Gross fixed capital formation (% of GDP) 22.0 20.0 20.1<br />
Exchange rates (national currency per US$) a 1.31 0.94 0.92<br />
Balance of payments, current account (million US$) 53 149 75 894 53 914<br />
CPI: Consumer price index (2000=100) 104 109 109<br />
Industrial production index (2005=100) 100 124 130<br />
Agricultural production index (2004-2006=100) 99 103 104<br />
Food production index (2004-2006=100) 99 103 104<br />
Unemployment (% of labour force) b 4.4 4.5 c 4.2<br />
Employment in industrial sector (% of employed) 23.7 de 21.1 cf 20.3 f<br />
Employment in agricultural sector (% of employed) 3.8 de 3.3 cf 3.5 f<br />
Labour force participation, adult female pop. (%) 59.5 60.8 61.2<br />
Labour force participation, adult male pop. (%) 75.0 75.3 75.3<br />
Tourist arrivals at national borders (000) gh 7 229 8 628 8 566<br />
Energy production, primary (000 mt oil equivalent) i 4 887 5 565 ...<br />
Mobile-cellular subscriptions (per 100 inhabitants) 92.2 125.8 135.3 j<br />
Individuals using the Internet (%) k 70.1 83.9 85.2<br />
Total trade Major trading partners 2012<br />
(million US$) l (% of exports) l (% of imports) l<br />
Exports 225 948.8 Germany 19.8 Germany 29.6<br />
Imports 197 786.9 United States 11.1 Italy 10.2<br />
Balance 28 161.9 Italy 7.1 France 8.4<br />
Social indicators<br />
Population growth rate (average annual %) 2010-2015 1.0<br />
Urban population growth rate (average annual %) 2010-2015 0.5<br />
Rural population growth rate (average annual %) 2010-2015 0.1<br />
Urban population (%) 2013 73.8<br />
Population aged 0-14 years (%) 2013 14.8<br />
Population aged 60+ years (females and males, % of total) 2013 25.4/21.4<br />
Sex ratio (males per 100 females) 2013 97.3<br />
Life expectancy at birth (females and males, years) 2010-2015 84.9/80.1<br />
Infant mortality rate (per 1 000 live births) 2010-2015 3.7<br />
Fertility rate, total (live births per woman) 2010-2015 1.5<br />
Contraceptive prevalence (ages 15-49, %) m 2006-2012 82.0 n<br />
International migrant stock (000 and % of total population) mid-2013 2 335.1/28.9<br />
Refugees and others of concern to UNHCR mid-2013 71 772<br />
Education: Government expenditure (% of GDP) 2006-2012 5.2<br />
Education: Primary-secondary gross enrolment ratio (f/m per 100) 2006-2012 98.2/99.9<br />
Education: Female third-level students (% of total) 2006-2012 49.3<br />
Intentional homicides (females and males, per 100 000) 2008-2010 0.7/0.8<br />
Seats held by women in national parliaments (%) 2014 31.0<br />
Environmental indicators<br />
Threatened species 2013 62<br />
Forested area (% of land area) 2011 31.1<br />
CO 2 emission estimates (000 metric tons and metric tons per capita) 2010 38 725/5.0<br />
Energy consumption per capita (kilograms oil equivalent) i 2010 2 459.0<br />
Precipitation in the capital city, total mean (millimetres) o<br />
1 086 p<br />
Temperature in the capital city, mean °C (minimum and maximum) o<br />
4.9/12.7 p<br />
a Official rate. b Age group 15 to 74 years. c Break in series; data not strictly comparable. d Official<br />
estimates. e The indices are shown in terms of ISIC Rev.3. f European Labour Force Survey (Eurostat). g<br />
Arrivals of non-resident tourists in hotels and similar establishments. h Includes health establishments.<br />
i Includes Liechtenstein for oil statistics. j Estimate. k Age group 14 years and over using the Internet<br />
within the last 6 months. l Includes Liechtenstein. m Age group 20 to 49 years. n 1994-1995. o Zurich.<br />
p Based on monthly averages for the period 1961-1990.<br />
World Statistics Pocketbook 191