

STATISTICS
LMTHw
LMTHw

You also want an ePaper? Increase the reach of your titles
YUMPU automatically turns print PDFs into web optimized ePapers that Google loves.
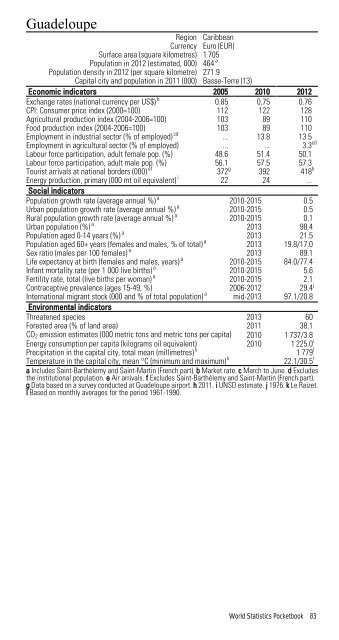
Guadeloupe<br />
Region Caribbean<br />
Currency Euro (EUR)<br />
Surface area (square kilometres) 1 705<br />
Population in 2012 (estimated, 000) 464 a<br />
Population density in 2012 (per square kilometre) 271.9<br />
Capital city and population in 2011 (000) Basse-Terre (13)<br />
Economic indicators 2005 2010 2012<br />
Exchange rates (national currency per US$) b 0.85 0.75 0.76<br />
CPI: Consumer price index (2000=100) 112 122 128<br />
Agricultural production index (2004-2006=100) 103 89 110<br />
Food production index (2004-2006=100) 103 89 110<br />
Employment in industrial sector (% of employed) cd ... 13.8 13.5<br />
Employment in agricultural sector (% of employed) ... ... 3.3 cd<br />
Labour force participation, adult female pop. (%) 48.6 51.4 50.1<br />
Labour force participation, adult male pop. (%) 56.1 57.5 57.3<br />
Tourist arrivals at national borders (000) ef 372 g 392 418 h<br />
Energy production, primary (000 mt oil equivalent) i 22 24 ...<br />
Social indicators<br />
Population growth rate (average annual %) a 2010-2015 0.5<br />
Urban population growth rate (average annual %) a 2010-2015 0.5<br />
Rural population growth rate (average annual %) a 2010-2015 0.1<br />
Urban population (%) a 2013 98.4<br />
Population aged 0-14 years (%) a 2013 21.5<br />
Population aged 60+ years (females and males, % of total) a 2013 19.8/17.0<br />
Sex ratio (males per 100 females) a 2013 89.1<br />
Life expectancy at birth (females and males, years) a 2010-2015 84.0/77.4<br />
Infant mortality rate (per 1 000 live births) a 2010-2015 5.6<br />
Fertility rate, total (live births per woman) a 2010-2015 2.1<br />
Contraceptive prevalence (ages 15-49, %) 2006-2012 29.4 j<br />
International migrant stock (000 and % of total population) a mid-2013 97.1/20.8<br />
Environmental indicators<br />
Threatened species 2013 60<br />
Forested area (% of land area) 2011 38.1<br />
CO 2 emission estimates (000 metric tons and metric tons per capita) 2010 1 737/3.8<br />
Energy consumption per capita (kilograms oil equivalent) 2010 1 225.0 i<br />
Precipitation in the capital city, total mean (millimetres) k<br />
1 779 l<br />
Temperature in the capital city, mean °C (minimum and maximum) k<br />
22.1/30.5 l<br />
a Includes Saint-Barthélemy and Saint-Martin (French part). b Market rate. c March to June. d Excludes<br />
the institutional population. e Air arrivals. f Excludes Saint-Barthélemy and Saint-Martin (French part).<br />
g Data based on a survey conducted at Guadeloupe airport. h 2011. i UNSD estimate. j 1976. k Le Raizet.<br />
l Based on monthly averages for the period 1961-1990.<br />
World Statistics Pocketbook 83